This section gives you an overview of the functionality MTEX offers to visualize spatial orientation data. Let us first import some sample EBSD data.
close all;
mtexdata forsterite
csFo = ebsd('Forsterite').CS;
ebsd = EBSD (y↑→x)
Phase Orientations Mineral Color Symmetry Crystal reference frame
0 58485 (24%) notIndexed
1 152345 (62%) Forsterite LightSkyBlue mmm
2 26058 (11%) Enstatite DarkSeaGreen mmm
3 9064 (3.7%) Diopside Goldenrod 12/m1 X||a*, Y||b*, Z||c
Properties: bands, bc, bs, error, mad
Scan unit : um
X x Y x Z : [0, 36550] x [0, 16750] x [0, 0]
Normal vector: (0,0,1)Phase Plots
By default, MTEX plots a phase map for EBSD data.
plot(ebsd)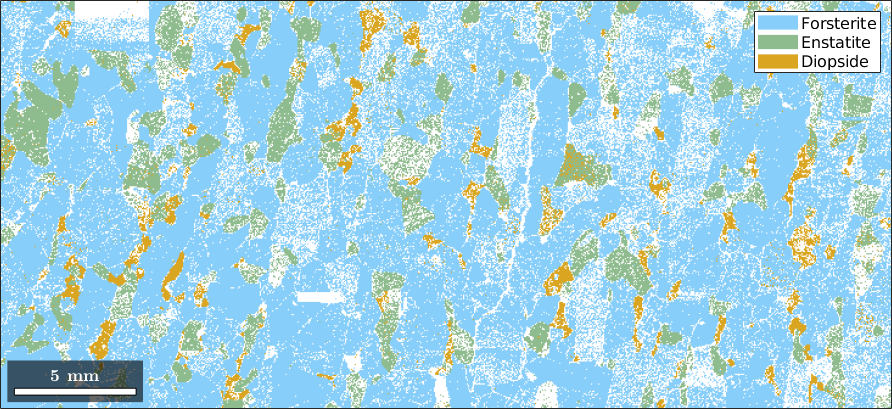
You can access the color of each phase by
ebsd('Diopside').colorans =
0.8549 0.6471 0.1255These values are RGB values which can be altered to any other RGB triple. A more convenient way for changing the color is the function str2rgb which converts color names into RGB triplets
ebsd('Diopside').color = str2rgb('salmon');

plot(ebsd('indexed'))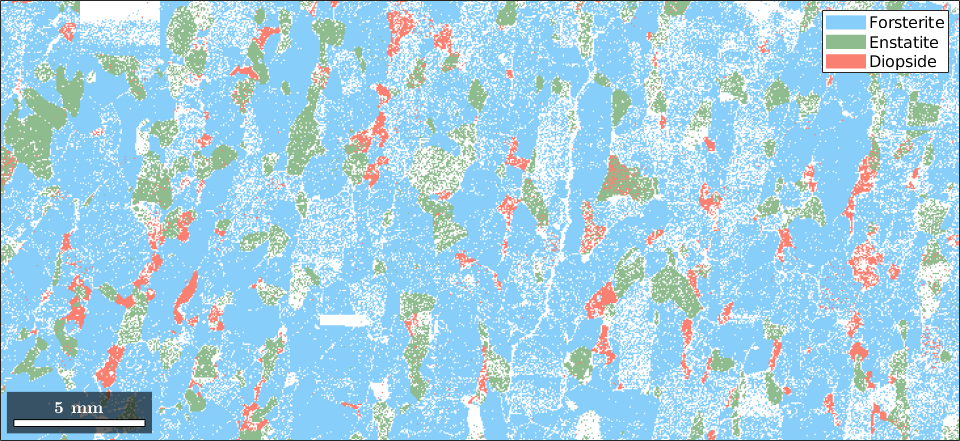
By default, not indexed phases are plotted as white and it is impossible to assign a different color as we did it for real phases. Instead we need to use option FaceColor to specify the color directly in the plotting command.
hold on
plot(ebsd('notIndexed'),'FaceColor','Gray')
hold off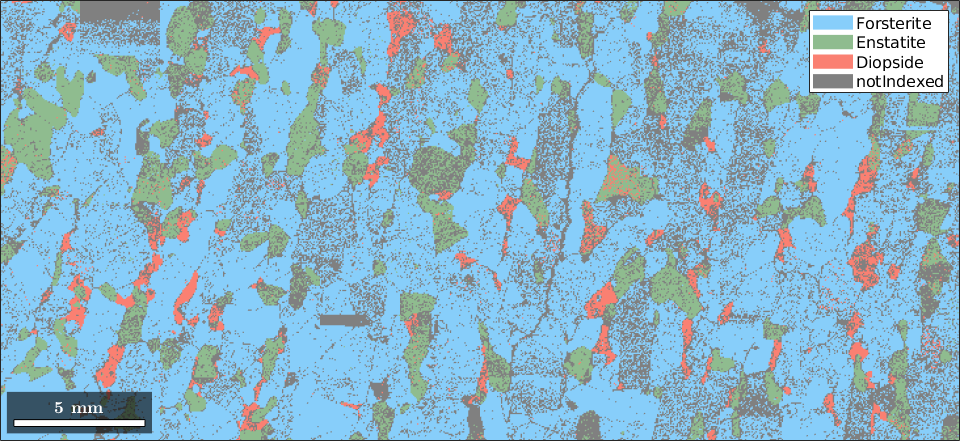
Visualizing arbitrary properties
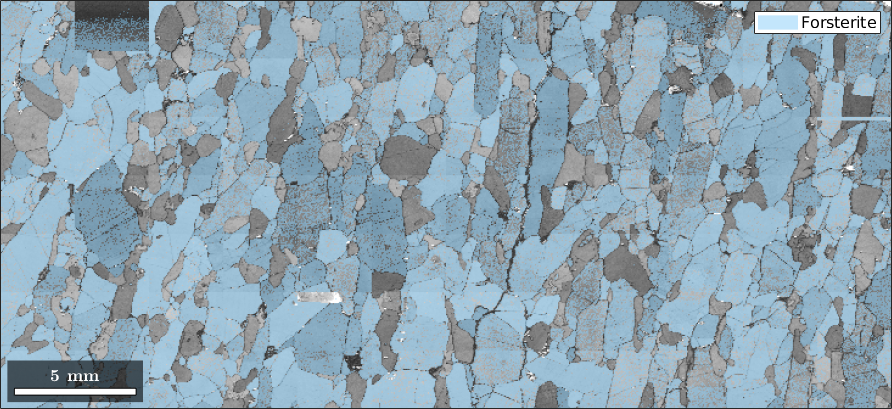
Apart from the phase information, we can use any other property to colorize the EBSD data. As an example, we may plot the band contrast
plot(ebsd,ebsd.bc)

colormap gray % make the image gray-scale
mtexColorbar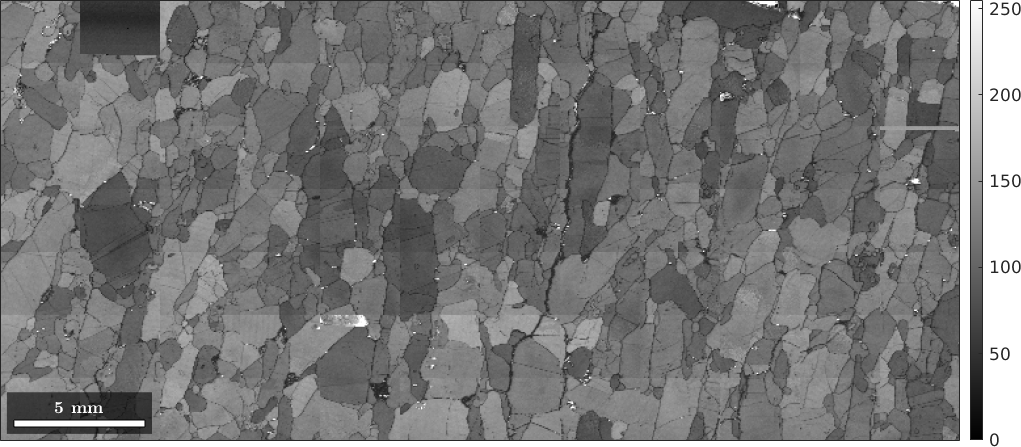
Visualizing orientations
Actually, we can pass any list of numbers or colors as a second input argument to be visualized together with the ebsd data. In order to visualize orientations in an EBSD map, we have first to compute a color for each orientation. The most simple way is to assign to each orientation its rotational angle. This is done by the command
plot(ebsd('Forsterite'),ebsd('Forsterite').orientations.angle./degree)
mtexColorbar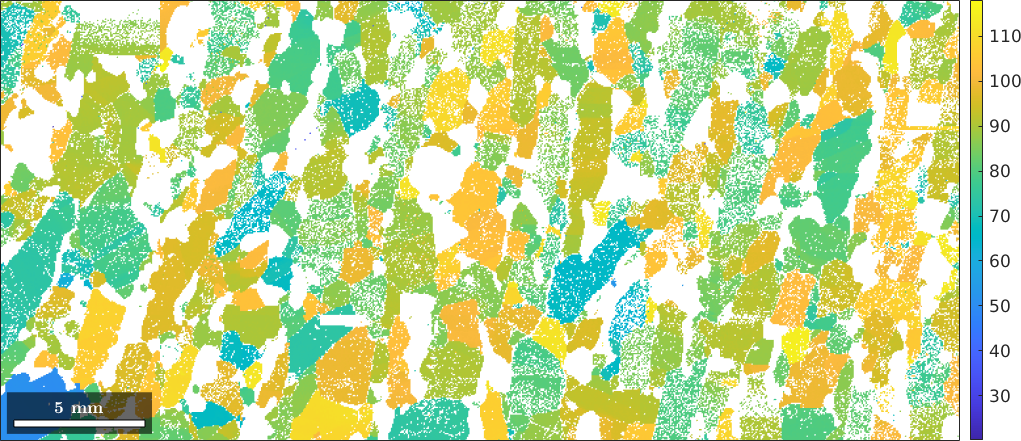
Obviously, the rotational angle is not a very distinctive representative for orientations. A more common approach is to define a colorization of the fundamental sector of the inverse pole figure, a so called ipf color key, and to colorize orientations according to their position in a fixed inverse pole figure. Let's consider the following standard key.
% this defines an ipf color key for the Forsterite phase
ipfKey = ipfColorKey(ebsd('Forsterite'));
ipfKey.inversePoleFigureDirection = vector3d.Z;

% this is the colored fundamental sector
plot(ipfKey)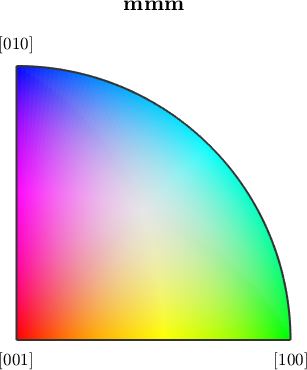
Next we may utilize this key to turn the orientations into colors, which are than passed to the plot command.
colors = ipfKey.orientation2color(ebsd('Forsterite').orientations);
plot(ebsd('Forsterite'),colors)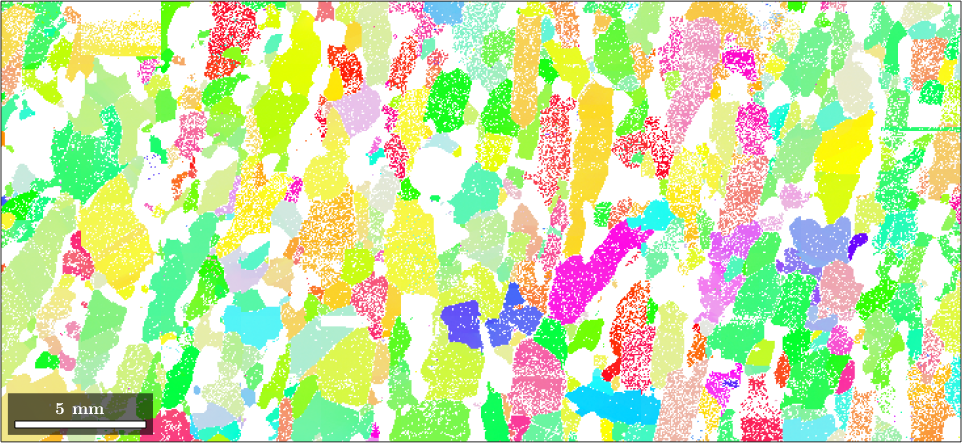
The above ipf color key can be largely customized. This is explained in more detail in IPF Maps. Beside IPF maps there are also more specific ways to colorize orientations as they are discussed in Advanced Plotting.
Superposing different plots
Combining different plots can be done either by plotting only subsets of the EBSD data or using the option 'faceAlpha' to control transparency.
plot(ebsd,ebsd.bc)
mtexColorMap black2white

hold on
plot(ebsd('Forsterite'),colors,'FaceAlpha',0.5)
hold off