In order to visualize orientation maps one has to assign a color to each possible orientation. As an example, one may think of representing an orientation by its Euler angles phi1, Phi, phi2 and taking these as the RGB values of a color. Of course, there are many other ways to do this. Before presenting all the possibilities MTEX offers to assign a color to each orientation let us shortly summarize what properties we expect from such an assignment.
- crystallographic equivalent orientations should have the same color
- similar orientations should have similar colors
- different orientations should have different colors
- the whole colorspace should be used for full contrast
- if the orientations are concentrated in a small region of the orientation space, the colorspace should be exhaust by this region
It should be noted that it is impossible to have all the 4 points mentioned above be satisfied by a single color coding. Hence, some compromises have to be accepted and some assumptions have to be made. While the traditional Euler angle coloring will assign different colors to similar orientations, i.e. will introduce color jumps and break with the first requirement the default MTEX color key will assign the same color to different orientations.
Hence, there is no perfect color key, but it should be chosen depending on the information one want to extract from the orientation data. To do so MTEX offers the following possibilities:
-
ipfHSVKeythe default color key -
ipfTSLKey -
ipfHKLKey -
BungeColorKey -
PatalaColorKey -
axisAngleColorKey -
spotColorKey -
ipfSpotKey
In order to demonstrate these color keys we first import some toy data set.
close all;
mtexdata forsterite silent
csFo = ebsd('Forsterite').CS;
Euler Angle Coloring
The oldest way to colorize orientations is to simply map the three Euler angles into the RGB values. This can be done by
colorKey = BungeColorKey(csFo);

plot(ebsd('fo'),colorKey.orientation2color(ebsd('fo').orientations))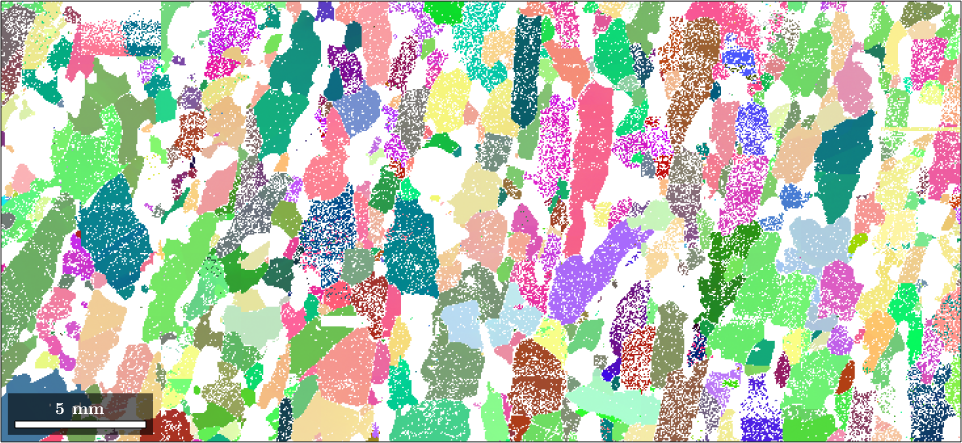
plot(colorKey)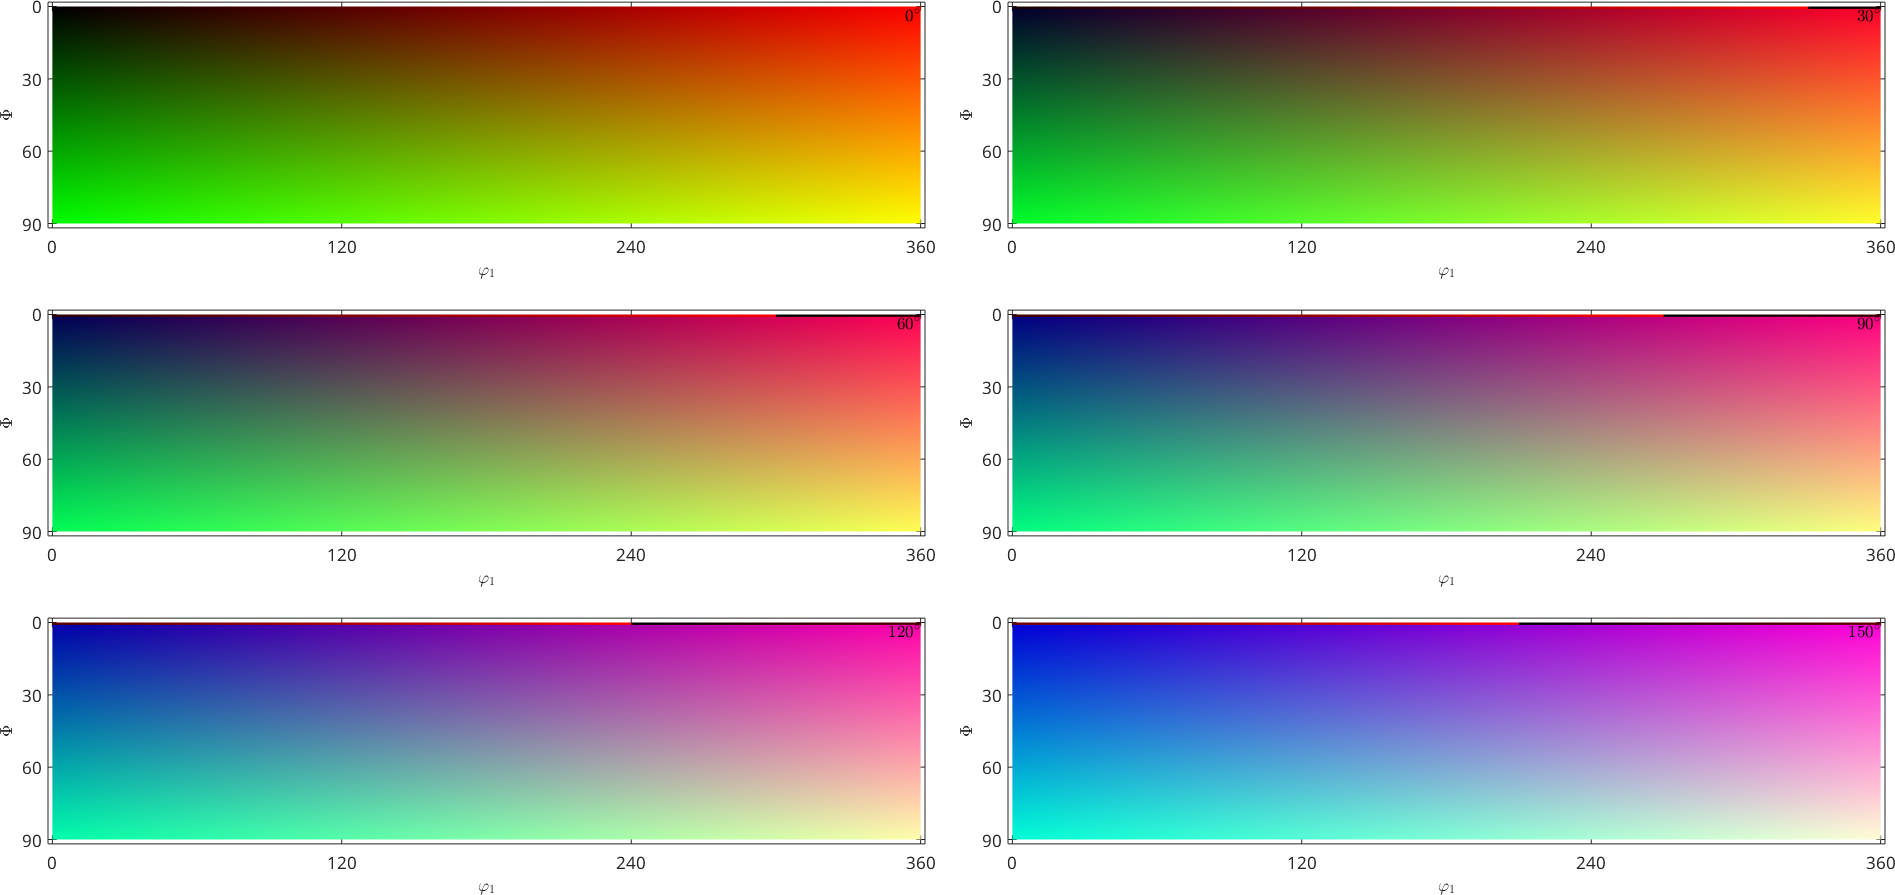
Although this visualization looks very smooth, the orientation map using Euler angles introduces many of color jumps. This becomes obvious when plotting the colors as sigma sections, i.e., for fixed differences \(\phi_1 - \phi_2\)
plot(colorKey,'sections',6,'sigma')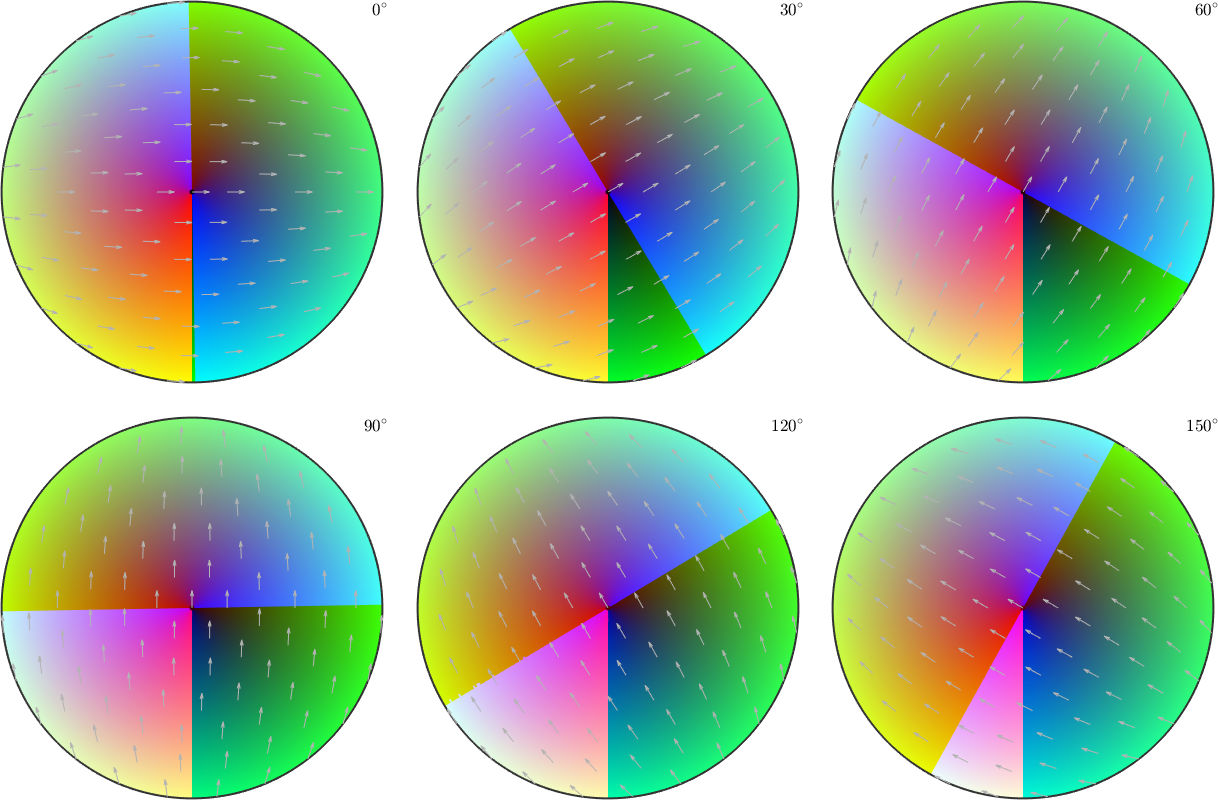
Coloring certain orientations
We might be interested in locating some special orientation in our orientation map. The definition of colors for certain orientations is carried out similarly as in the case of fibers
colorKey = spotColorKey(ebsd('Fo'));
colorKey.center = mean(ebsd('Forsterite').orientations,'robust');
colorKey.color = [0,0,1];
colorKey.psi = SO3DeLaValleePoussinKernel('halfwidth',20*degree);

plot(ebsd('fo'),colorKey.orientation2color(ebsd('fo').orientations))

% and the corresponding color-map
figure(2)
plot(colorKey,'sections',9,'sigma')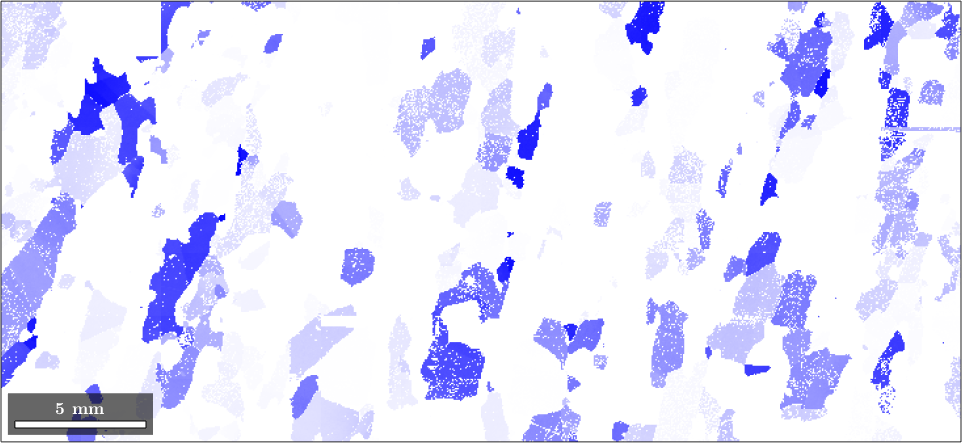
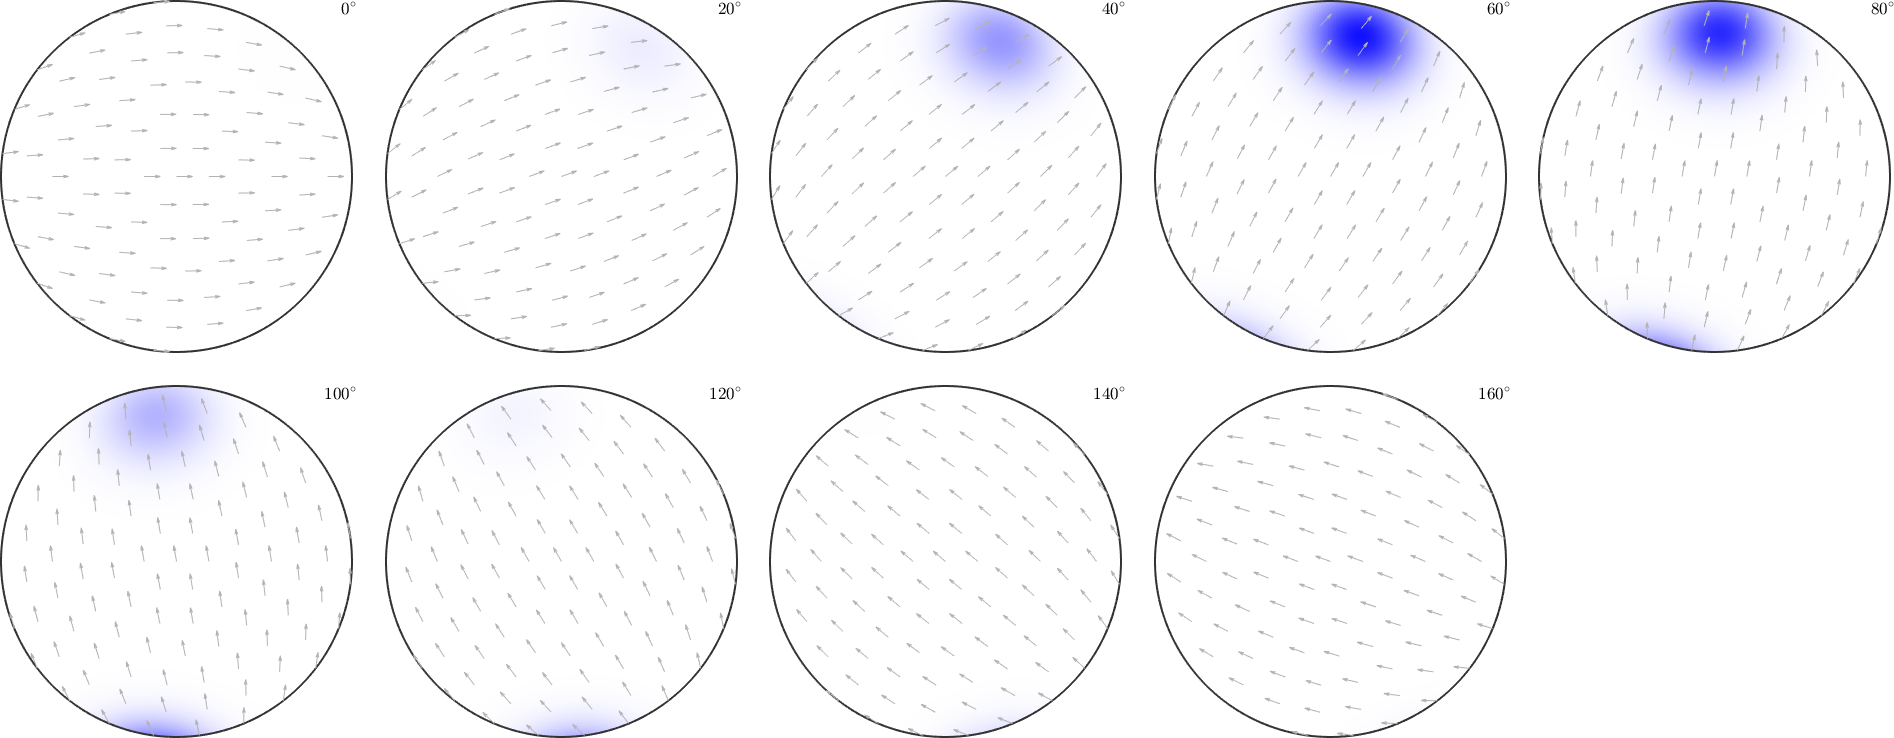
the area of the colored EBSD data in the map corresponds to the volume portion (in percent)
vol = 100 * volume(ebsd('fo').orientations,colorKey.center,20*degree)vol =
12.1409actually, the colored measurements stress a peak in the ODF
close all
odf = calcDensity(ebsd('fo').orientations,'halfwidth',10*degree,'silent');
plot(odf,'sections',9,'silent','sigma')
mtexColorbar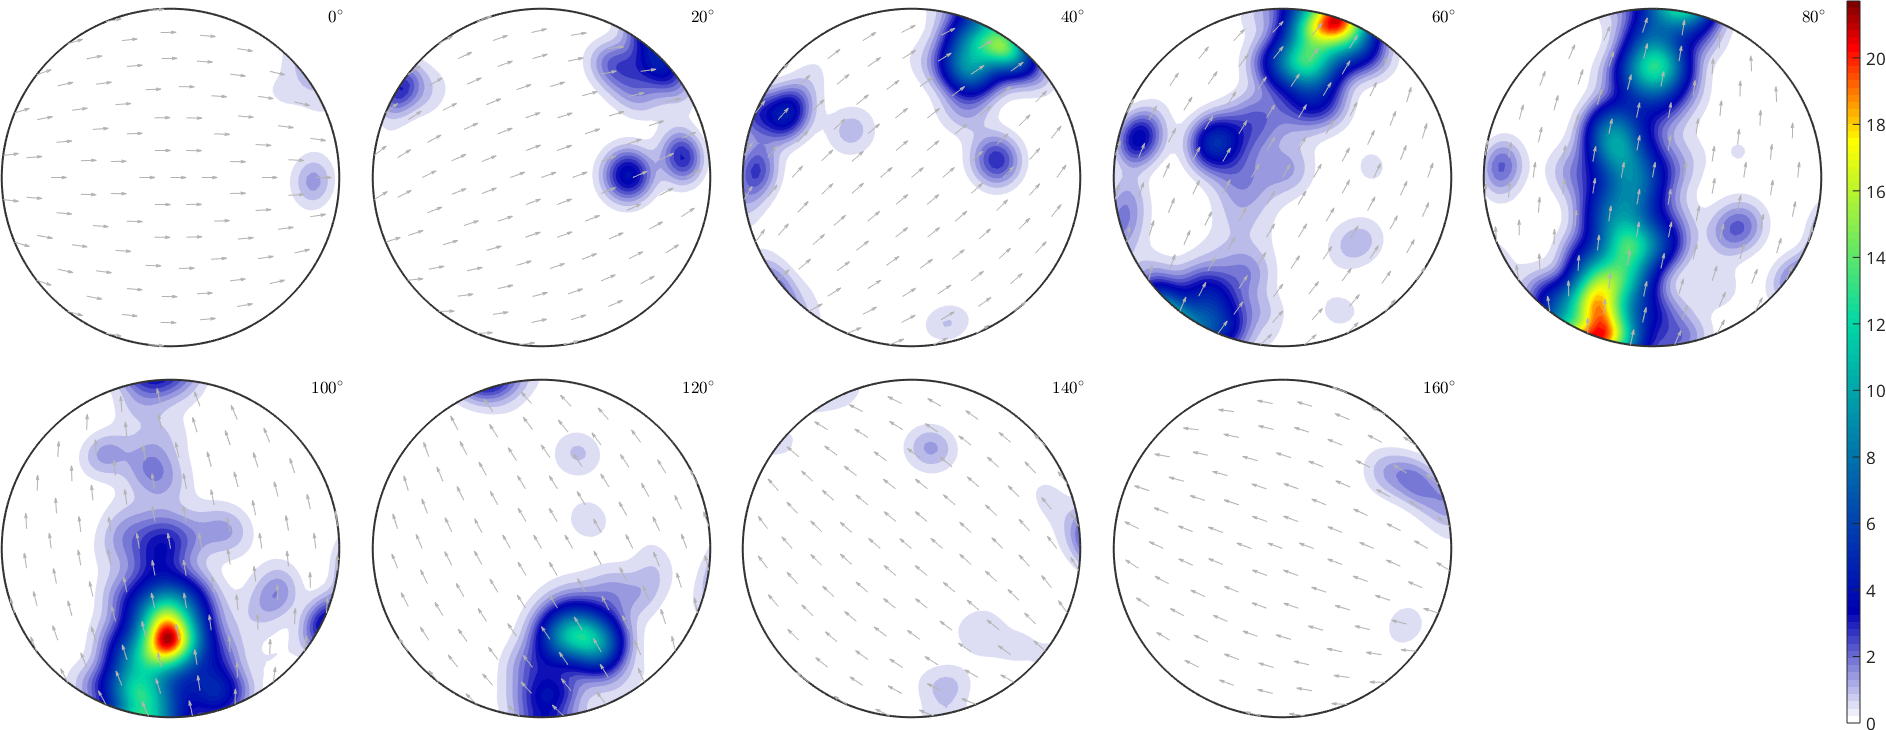
Coloring fibers
To color a fibre, one has to specify the crystal direction h together with its RGB color and the specimen direction r, which should be marked.
% define a fibre
f = fibre(Miller(1,1,1,csFo),zvector);

% set up coloring
colorKey = ipfSpotKey(csFo);
colorKey.inversePoleFigureDirection = f.r;
colorKey.center = f.h;
colorKey.color = [0 0 1];
colorKey.psi = S2DeLaValleePoussinKernel('halfwidth',7.5*degree);

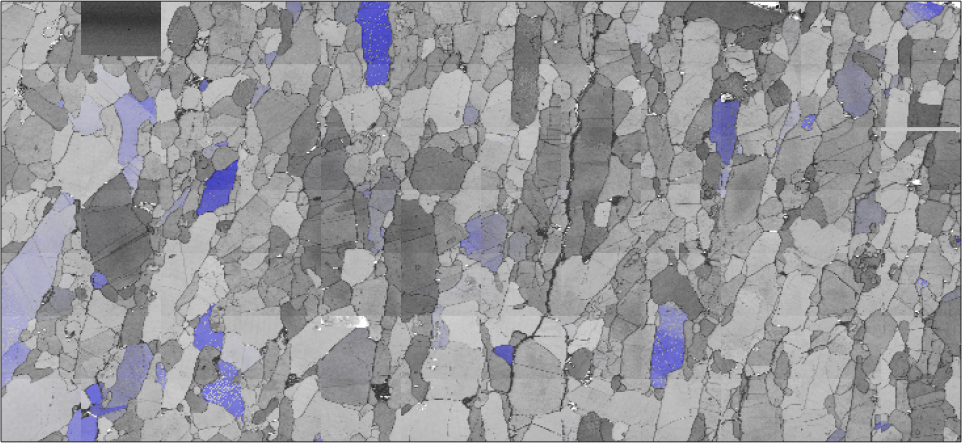
plot(ebsd('fo'),colorKey.orientation2color(ebsd('fo').orientations))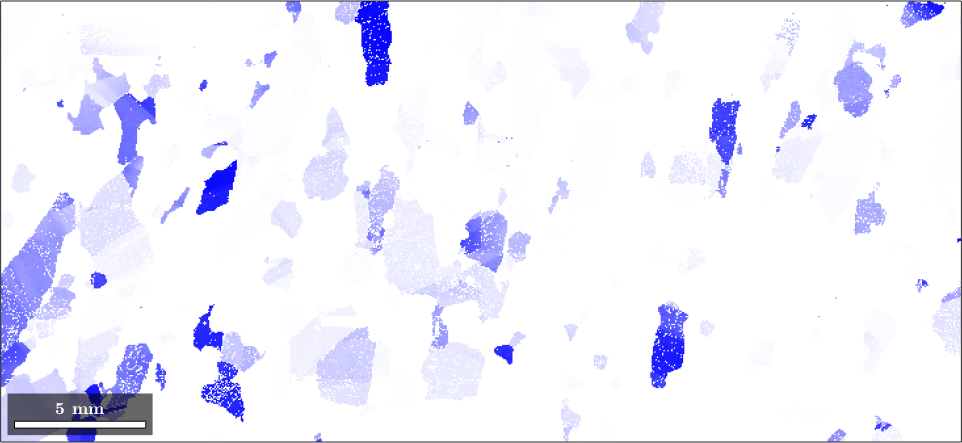
the option 'halfwidth' controls half of the intensity of the color at a given distance. Here we have chosen the (111)[001] fibre to be drawn in blue, and at 7.5 degrees, where the blue should be only lighter.
plot(colorKey)
hold on
circle(f.h.project2FundamentalRegion,15*degree,'linewidth',2)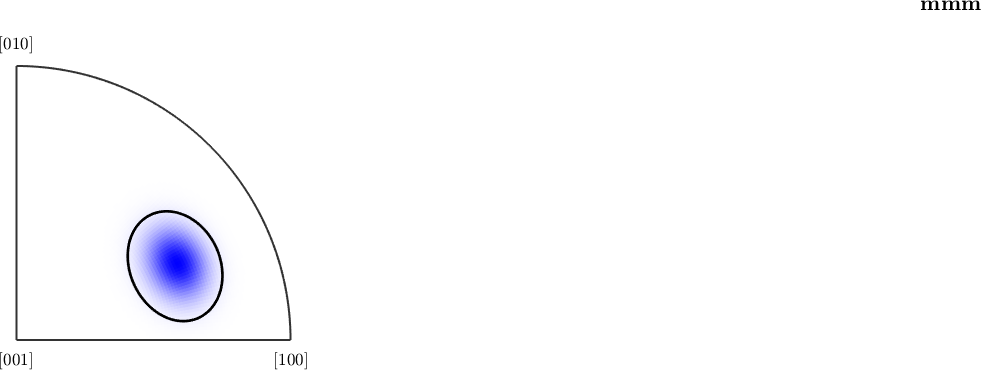
the percentage of blue colored area in the map is equivalent to the fibre volume
vol = volume(ebsd('fo').orientations,f,15*degree)

plotIPDF(ebsd('fo').orientations,zvector,'markercolor','k','marker','x','points',200)
hold off
vol =
0.2480
I'm plotting 200 random orientations out of 152345 given orientations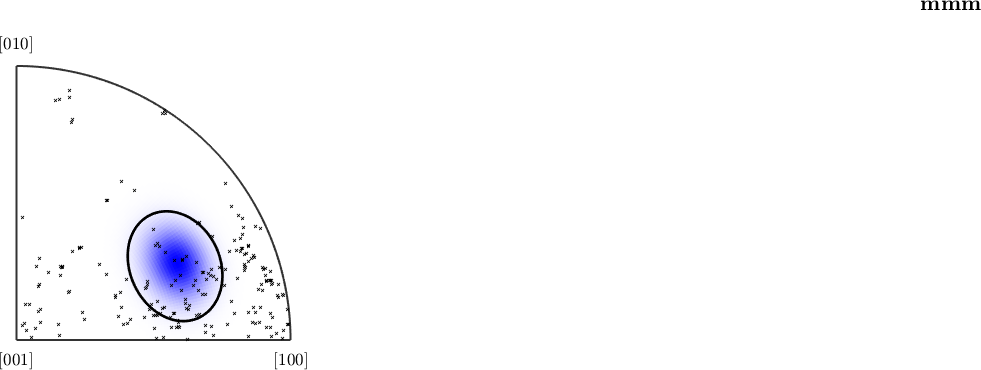
we can easily extend the color-coding
% the centers in the inverse pole figure
colorKey.center = Miller({0 0 1},{0 1 1},{1 1 1},{11 4 4},{5 0 2},{5 5 2},csFo);

% the corresponding colors
colorKey.color = [[1 0 0];[0 1 0];[0 0 1];[1 0 1];[1 1 0];[0 1 1]];

% plot the key
plot(colorKey)
hold on
plot(ebsd('fo').orientations,'MarkerFaceColor','none','MarkerEdgeColor','k','MarkerSize',3,'points',1000)
hold off
I'm plotting 1000 random orientations out of 152345 given orientations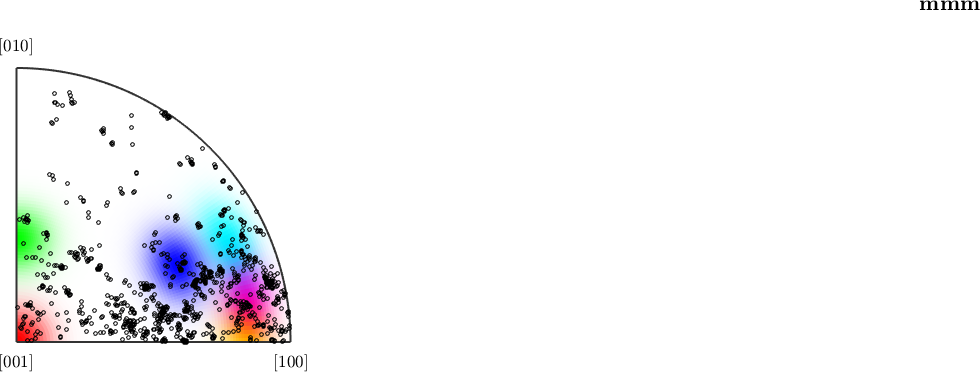
close all;
plot(ebsd('fo'),colorKey.orientation2color(ebsd('fo').orientations))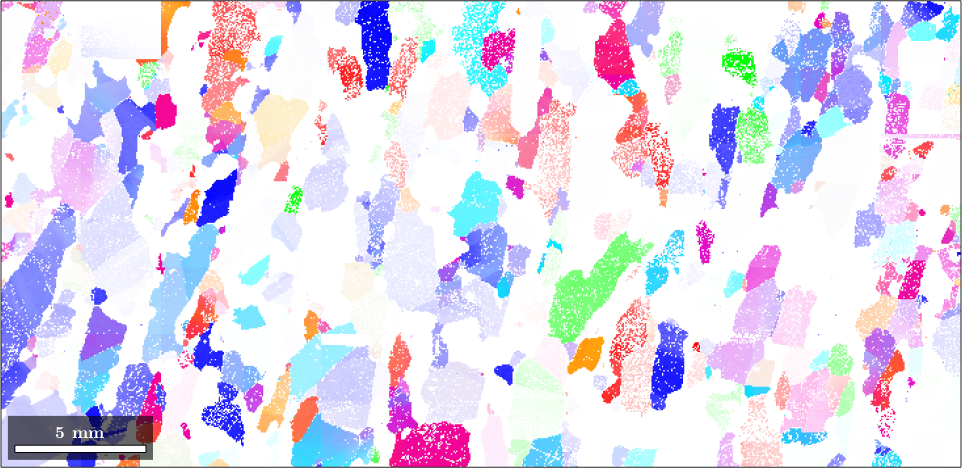
Combining different plots
Combining different plots can be done either by plotting only subsets of the EBSD data or via the option 'faceAlpha'. Note that the option 'faceAlpha' requires the renderer of the figure to be set to 'opengl'.
close all;
plot(ebsd,ebsd.bc,'micronbar','off')
mtexColorMap black2white

colorKey = ipfSpotKey(csFo);
colorKey.inversePoleFigureDirection = zvector;
colorKey.center = Miller(1,1,1,csFo);
colorKey.color = [0 0 1];
colorKey.psi = S2DeLaValleePoussinKernel('halfwidth',7.5*degree);

hold on
plot(ebsd('fo'),colorKey.orientation2color(ebsd('fo').orientations),'FaceAlpha',0.5)
hold off