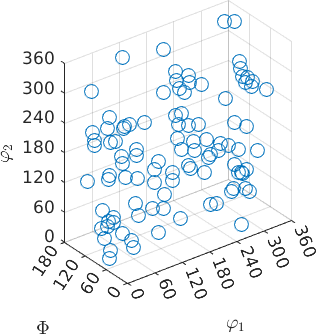
The function scatter allows you to visualize a rotation in Rodriguez space.
% define 100 random rotations
rot = rotation.rand(100)

% and plot the Rodriguez space
scatter(rot)
rot = rotation
  size: 100 x 1