How to customize contour plots in MTEX
Lets consider an arbitrary spherical function which has no practical meaning at all but serves as a prototype for pole figures, inverse pole figures, Schmidt or Taylor factor maps, etc.
% define the spherical function
sF = 0.01 + 10*S2Fun.smiley

% and plot it as a smooth function
plotx2north
plot(sF,'upper')
mtexColorMap blue2red
mtexColorbar
sF = S2FunHarmonic (y←↑x)
bandwidth: 128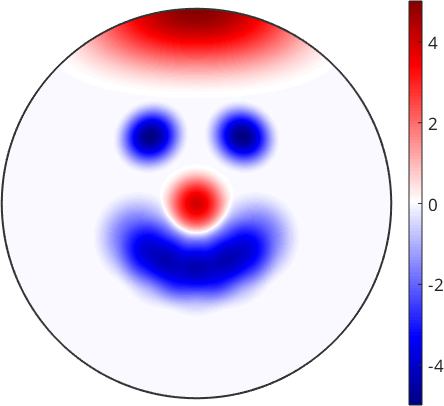
Passing the option contour to the plot command we may add contours at specific levels on top of the smooth plot
% enable on top plotting
hold on

% specify the contour levels
levels = -4:5;

% plot the contours
h = plot(sF,'contour',levels,'linewidth',2,'linecolor','k')

% diable on top plotting
hold off
h =
Contour with properties:
EdgeColor: [0 0 0]
LineStyle: '-'
LineWidth: 2
FaceColor: 'none'
LevelList: [-4 -3 -2 -1 0 1 2 3 4 5]
XData: [91×361 double]
YData: [91×361 double]
ZData: [91×361 double]
Use GET to show all properties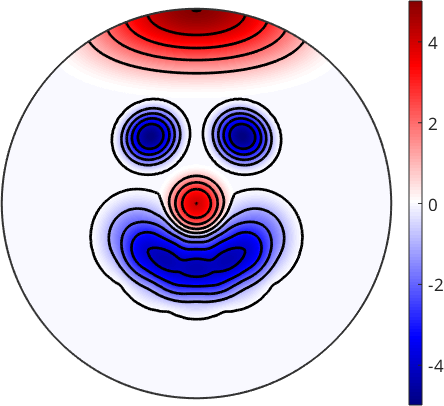
The plotting command return a handle h to the plotted contours. This handle can be used to customize the contour lines. In particular, one can use the Matlab command clabel to add labels to specific contour levels.
levels2label = [-2,0:5];
clabel(h.ContourMatrix,h,levels2label,'FontSize',15)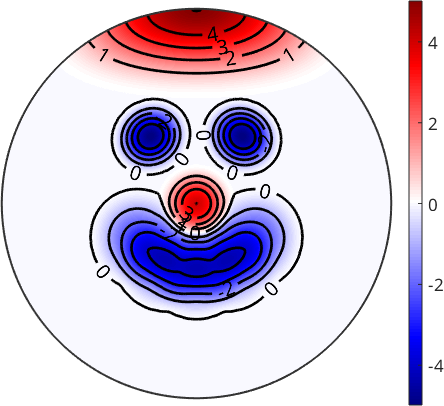
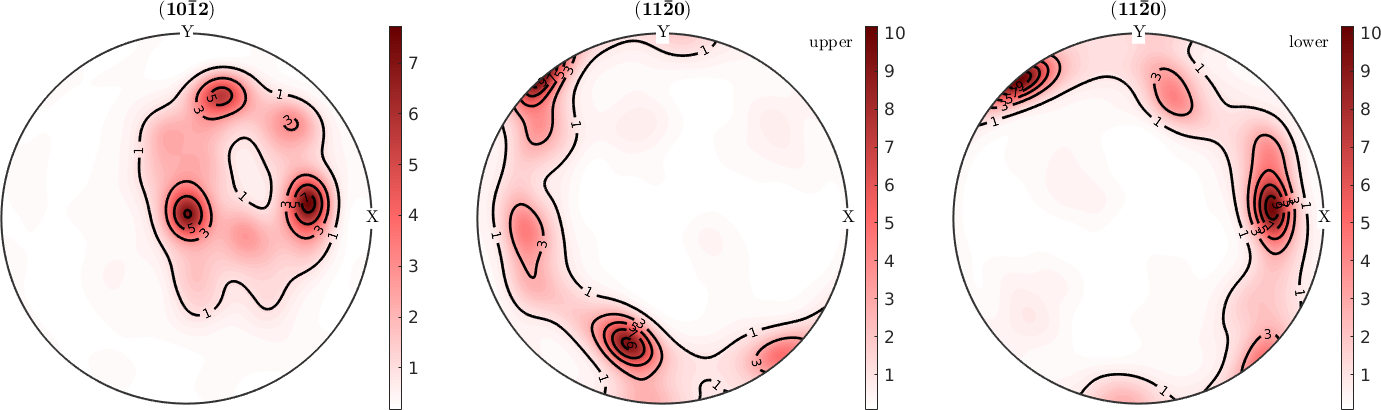
A practical example
The situation becomes a little bit more involved if contour lines should be added to multiple plot. Let us consider the pole figures of the following ODF
mtexdata dubna
odf = calcODF(pf,'silent')
pf = PoleFigure (y↑→x)
crystal symmetry : Quartz (321, X||a*, Y||b, Z||c*)
h = (02-21), r = 72 x 19 points
h = (10-10), r = 72 x 19 points
h = (10-11)(01-11), r = 72 x 19 points
h = (10-12), r = 72 x 19 points
h = (11-20), r = 72 x 19 points
h = (11-21), r = 72 x 19 points
h = (11-22), r = 72 x 19 points
odf = SO3FunRBF (Quartz → y↑→x)
multimodal components
kernel: de la Vallee Poussin, halfwidth 5°
center: 19848 orientations, resolution: 5°
weight: 1Then we may use the option 'ShowText','on' to display contour labels.
h = pf{4:5}.h;
plotPDF(odf,h)
mtexColorMap LaboTeX
mtexColorbar

hold on
plotPDF(odf,h,'contour',1:2:15,'linecolor','black','linewidth',2,'ShowText','on')
hold off