In many cases texture measurements are acquired in the form of a series of points or intensities. EBSD measurements are usually a grid of measurement points, while pole figure measurements are often angular positions combined with intensity values. However, in many cases we want to do analysis that requires a continuous function, in which case we want to determine the continuous function that best represents our data points. This section discusses the mathematical basis of this calculation and how it is affected by some of the parameters involved.
In mathematical terms, density estimation is a concept that describes estimation of a probability density function \(f_N\) from given random samples \(x_n\), \(n=1,\ldots,N\). In the simplest case the random samples \(x_n\) are real numbers and come from an unknown distribution function \(f\). The goal is to ensure that \(f_N\) approximates \(f\) as well as possible.
Lets illustrate this starting with the example of a mixed Gaussian distribution
% Define the true density function, in this case made by combining two
% Gaussians

f = @(x) (Gaussian(0.2,0.05,x) + Gaussian(0.5,0.2,x))/2;

% generate 1000 points linearly spaced between 0 and 1
x = linspace(0,1,1000);
% use these points to plot the true density function as blue lines
plot(x,f(x),'linewidth',2)
xlabel('x');ylabel('f(x)')

% generate a random sample of points from the function f(x)
N = 20;
xN = discreteSample(f,N,'range',[0,1]);

% plot the random sample as red circles
hold on
plot(xN,zeros(size(xN)),'o','LineWidth',2,'MarkerEdgeColor','r')
hold off
Note that the higher the peak of the original function, the more points randomly generated. Because the red points are randomly generated, your plot will look slightly different.
The Histogram
The easiest way to estimate a density function from the sample \(x_n\) is with a histogram
histogram(xN,10)
hold on
plot(x,f(x),'linewidth',2)
plot(xN,zeros(size(xN)),'o','LineWidth',2,'MarkerEdgeColor','r')
hold off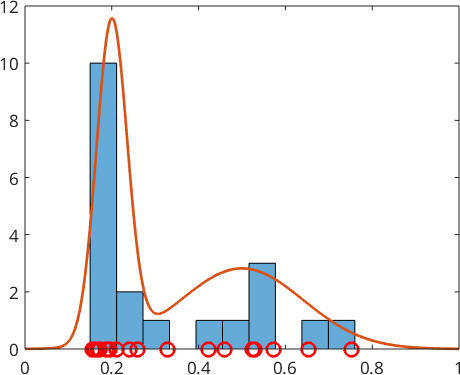
However, since the histogram always leads to a piecewise constant function (step function) the fit to the true density function \(f\) is usually not so good. A better alternative is kernel density estimation.
Kernel Density Estimation
The idea of kernel density estimation is to pick some kernel function \(\psi\), e.g. a Gaussian with mean \(0\) and standard deviation \(0.05\),
psi = Gaussian(0,0.05);shift its center to the position of each sample points \(x_n\)
% plot the random sample
plot(xN,zeros(size(xN)),'o','LineWidth',2,'MarkerEdgeColor','r')
hold on

% for each random sample plot a centered Gaussian
for n = 1:N, plot(x,psi(x-xN(n)),'k'); end
hold off
and take the mean
\[ f(x) = \frac{1}{N} \sum_{n=1}^N \psi(x-x_n) \]
of all the these shifted kernel functions
% take the mean over all shifted kernel functions
fN = @(x) mean(psi(x-xN),1);

hold on
% plot the resulting estimate of the original function
plot(x,fN(x),'linewidth',3,'Color',ind2color(2))

% plot the "true" density function
plot(x,f(x),'linewidth',3,'Color',ind2color(1))
hold off
We observe that this gives a much better approximation to true density function \(f\). The most important parameter when computing the kernel density estimate of a random sample is the halfwidth or standard deviation of the corresponding kernel function. Lets repeat the above density estimation with three different standard deviations
% plot the true density function
plot(x,f(x),'linewidth',3)
hold on

% and on top the kernel density estimates with different halfwidth
delta = [0.01 0.05 0.25];
for d = delta

  psi = Gaussian(0,d);
  fN = @(x) mean(psi(x-xN),1);
  plot(x,fN(x),'linewidth',3)

end
hold off
legend('\(f\)','\(f_{0.01}\)','\(f_{0.05}\)','\(f_{0.25}\)','interpreter','Latex'),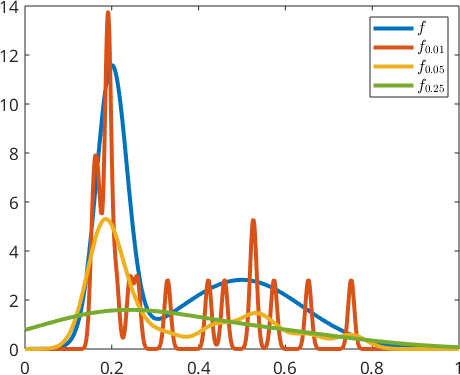
In general a too small halfwidth leads to heavily oscillating functions, while a too large halfwidth will result in excessively smooth functions. In the case of one dimensional data kernel density estimation MTEX includes automatic optimization of the halfwidth when using the command calcDensity.
fN = calcDensity(xN,'range',[0;1]);t_star =
0.0023Optionally, we may control the halfwidth by the option 'bandwidth', i.e., fN = calcDensity(xN,'range',[0;1],'bandwidth',0.004)
plot(x,f(x),'linewidth',2)
hold on
plot(x,fN(x),'linewidth',2)
hold off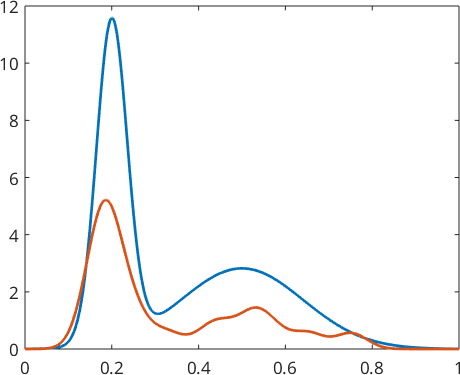
Optimal Halfwidth Selection
Selecting an optimal kernel halfwidth is a tough problem. MTEX provides a couple of methods for this purpose which are explained in detail in the section Optimal Kernel Selection.
Kernel Density Estimation in d-Dimensions
The command calcDensity may also be applied to \(d\)-dimensional data. For simplicity lets consider a two-dimensional example where both \(x\) and \(y\) coordinates are distributed according to the distribution \(f\) defined at the very beginning of this section.
% Get a number of random sample points from the function.
N = 100;
xN = discreteSample(f,N);
yN = discreteSample(f,N);

% plot the random sample as red circles
scatter(xN,yN,'o','LineWidth',2,'MarkerEdgeColor','r')
axis equal tight
%xlabel('x');ylabel('f(x)')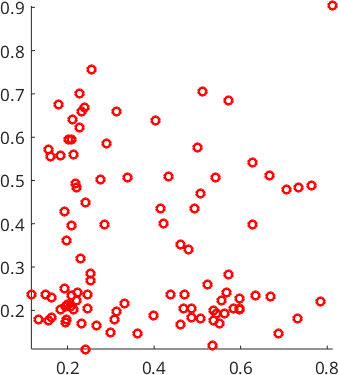
Similarly to the one dimensional example we need to specify the range of the \(x\) and \(y\) coordinates for the estimated density function. The format is [xMin yMin; xMax yMax].
% compute the two dimensional density function based on the random points
fN = calcDensity([xN,yN],'range',[0 0;1 1]);

% plot the two dimensional density function
[x,y] = ndgrid(linspace(0,1));
contourf(x,y,fN(x,y),'LevelStep',2)
mtexColorMap LaboTeX
shading interp
axis equal tight

% plot the original random sample on top
hold on
scatter(xN,yN,'.','r')
hold off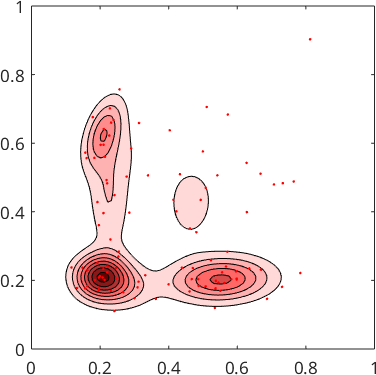
Density Estimation for Directional Data
Kernel density for directional (misorientation/ crystallographic axis) data works analogously as for real valued data. Again we have to choose a kernel function \(\psi\) with a certain halfwidth \(\delta\). Than the kernel functions are centered at each direction of our random sampling and summed up. Lets us demonstrate this procedure for misorientation axes between two phases in an EBSD map
% import ebsd data
mtexdata forsterite silent

% reconstruct grains
grains = calcGrains(ebsd('indexed'));

% extract Forsterite to Enstatite grain boundaries
gB = grains.boundary('Forsterite','Enstatite');

% plot misorientation axes of the data over the fundamental region of orientation space
plot(gB.misorientation.axis,'fundamentalRegion','MarkerFaceAlpha',0.1)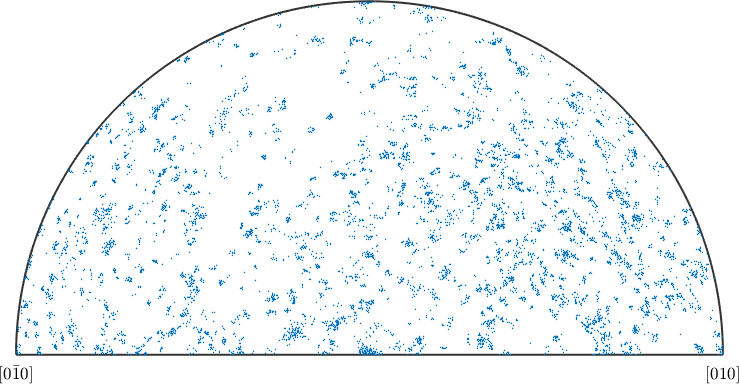
The distribution of the misorientation axes may be analyzed in more detail by computing the misorientation axis distribution function
% compute the misorientation axis distribution function
axisDensity = calcDensity(gB.misorientation.axis);

% plot the density function
contourf(axisDensity)
mtexColorMap LaboTeX
mtexColorbar

% and on top of it the misorientation axes
hold on
plot(gB.misorientation.axis,'MarkerEdgeAlpha',0.25,...
  'MarkerFaceColor','none','MarkerEdgeColor','k')
hold off
Note that the resulting variable axisDensity is of type S2FunHarmonicSym and allows for all the operations as explained in the section Operations on Spherical Functions. In order to stress once again the importance of the choice of the halfwidth of the kernel function we perform the same calculation as above but with the halfwidth set to 5 degree
axisDensity = calcDensity(gB.misorientation.axis,'halfwidth',5*degree);

contourf(axisDensity)
mtexColorMap LaboTeX
mtexColorbar

hold on
plot(gB.misorientation.axis,'MarkerEdgeAlpha',0.25,...
  'MarkerFaceColor','none','MarkerEdgeColor','k')
hold off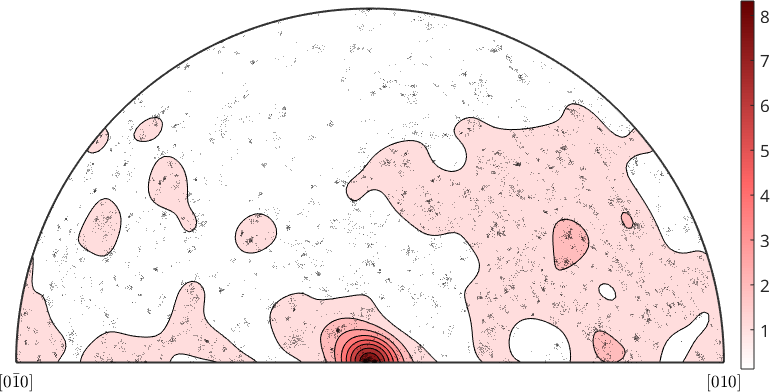
Density Estimation for Orientation Data
Density estimation from orientations sets the connection between individual crystal orientations, as e.g. measured by EBSD, and the orientation distribution function of a specimen. Considering the Forsterite orientations from the above EBSD map the corresponding ODF computes to
odf = calcDensity(ebsd('Forsterite').orientations,'halfwidth',10*degree)odf = SO3FunHarmonic (Forsterite → y↑→x)
bandwidth: 25
weight: 1Lets visualize the ODF in phi2 sections and plot on top of it the individual orientation measurements from the EBSD map
plotSection(odf,'contourf')
mtexColorMap LaboTeX

hold on
plot(ebsd('Forsterite').orientations,'MarkerEdgeAlpha',0.25,...
  'MarkerFaceColor','none','MarkerEdgeColor','k','MarkerSize',10)
hold off
plotting 2000 random orientations out of 152345 given orientations
A more detailed description of ODF estimation from individual orientation measurements can be found in the section ODF Estimation from EBSD data.
Parametric Density Estimation
In contrast to kernel density estimation, parametric density estimation makes the assumption that the true distribution function belongs to a parametric distribution family, e.g. the Gaussian. In this case it estimates the parameters of this distribution from the random sample. In the case of the Gaussian distribution these parameters are the mean value and the standard deviation. On spheres and in orientation space, the analogous functions to the Gaussian are the Bingham distributions. The estimation of Bingham parameters from directional and rotational data is explained in the sections The Spherical Bingham Distribution and The Rotational Bingham Distribution.
Density Estimation with Weights
In many use cases one has a weighted random sample. A typical example is if one wants to estimate a orientation distribution function from grain orientations. In this cases big grains should contribute more to the ODF than small grains. For that reason the functions calcDensity allow for an additional option 'weights' which will pass weights to the density estimation.
mtexdata titanium silent
grains = calcGrains(ebsd);

odf = calcDensity(grains.meanOrientation,'weights',grains.numPixel)
odf = SO3FunRBF (Titanium (Alpha) → y↑→x)
multimodal components
kernel: de la Vallee Poussin, halfwidth 10°
center: 85 orientations