Low-angle grain boundaries (LAGB) or subgrain boundaries are those with a misorientation less than about 15 degrees. Generally speaking they are composed of an array of dislocations and their properties and structure are a function of the misorientation. In contrast the properties of high-angle grain boundaries, whose misorientation is greater than about 15 degrees, are normally found to be independent of the misorientation. However, there are special boundaries at particular orientations whose interfacial energies are markedly lower than those of general high-angle grain boundaries.
In order to demonstrate the analysis of subgrain boundaries in MTEX we start by importing an sample EBSD data set
% load some test data
mtexdata ferrite silent
For the computation of low-angle boundaries we specify two thresholds during grain reconstruction: the first value controls the low-angle grain boundaries whereas the second is used for the high-angle grain boundaries.
[grains,ebsd.grainId] = calcGrains(ebsd('indexed'),...
  'threshold',[1*degree, 10*degree],'minPixel',5);

% lets smooth the grain boundaries a bit
grains = smooth(grains,5)
grains = grain2d (y↑→x)
Phase Grains Pixels Mineral Symmetry Crystal reference frame
0 250 58925 Ferrite 432
boundary segments: 12865 (2526 µm)
inner boundary segments: 28540 (3619 µm)
triple points: 423
Properties: meanRotation, GOSWe observe that we have 12314 high-angle boundary segments and 28501 low-angle boundary segments. In order to visualize the the subgrain boundaries we first plot the ebsd data colorized by orientation. On top we plot with solid lines the grain boundaries and with thinner lines the subgrain boundaries. We even make the misorientation angle at the subgrain boundaries visible by setting it as the transparency value of the segments.
% plot the ebsd data
plot(ebsd('indexed'),ebsd('indexed').orientations,'faceAlpha',0.5,'figSize','large')

% init override mode
hold on

% plot grain boundares
plot(grains.boundary,'linewidth',2)

% compute transparency from misorientation angle
alpha = grains.innerBoundary.misorientation.angle / (5*degree);

% plot the subgrain boundaries
plot(grains.innerBoundary,'linewidth',1.5,'edgeAlpha',alpha,'linecolor','b');

% stop override mode
hold off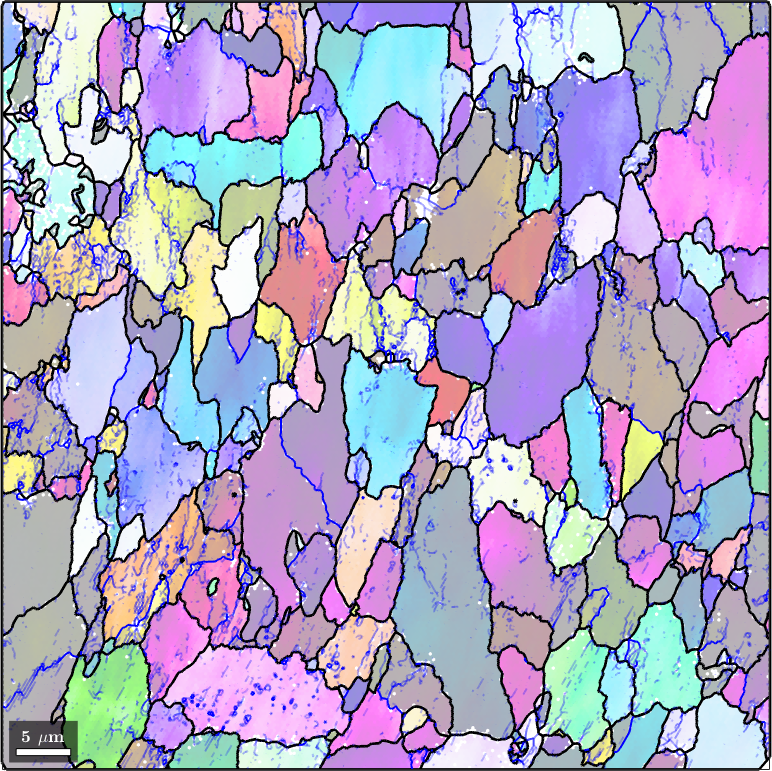
Subgrain Boundary Density
The number of low-angle boundary segments inside each grain can be computed by the command subBoundarySize. In the following figure we use it to visualize the density of subgrain boundaries per grain pixel.
plot(grains, grains.subBoundarySize ./ grains.numPixel)
mtexColorbar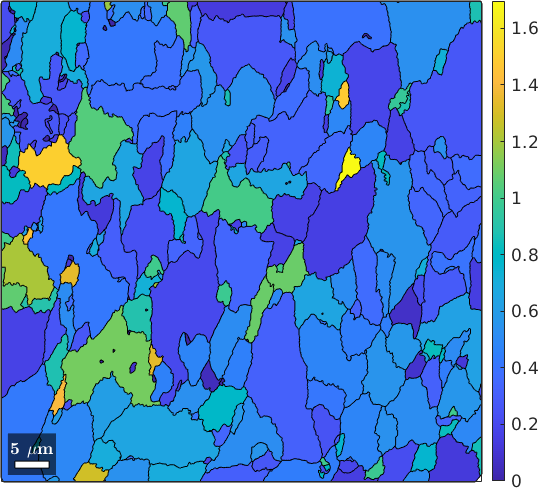
We may compute also the density of low-angle boundaries per grain as the length of the subgrain boundaries divided by the grain area. This can be done using the commands subBoundaryLength and area
plot(grains, grains.subBoundaryLength ./ grains.area)
mtexColorbar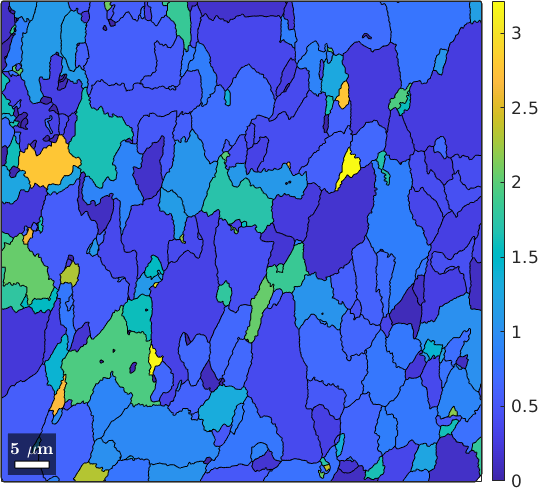
Misorientation at Subgrain Boundaries
Apart from the spatial distribution of the subgrain boundaries we may also analyze the distribution of their misorientations.
% extract all subgrain boundary misorientation
mori = grains.innerBoundary.misorientation;

% and visualize the distribution of the misorientation axes
plot(mori.axis,'fundamentalRegion','contourf','figSize','small')

mtexColorbar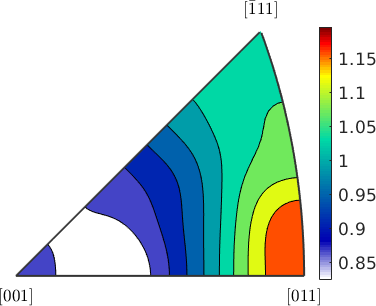
A more detailed analysis of the misorientation axes at subgrain boundaries can be found in the chapter Tilt and Twist Boundaries.
Connected Components
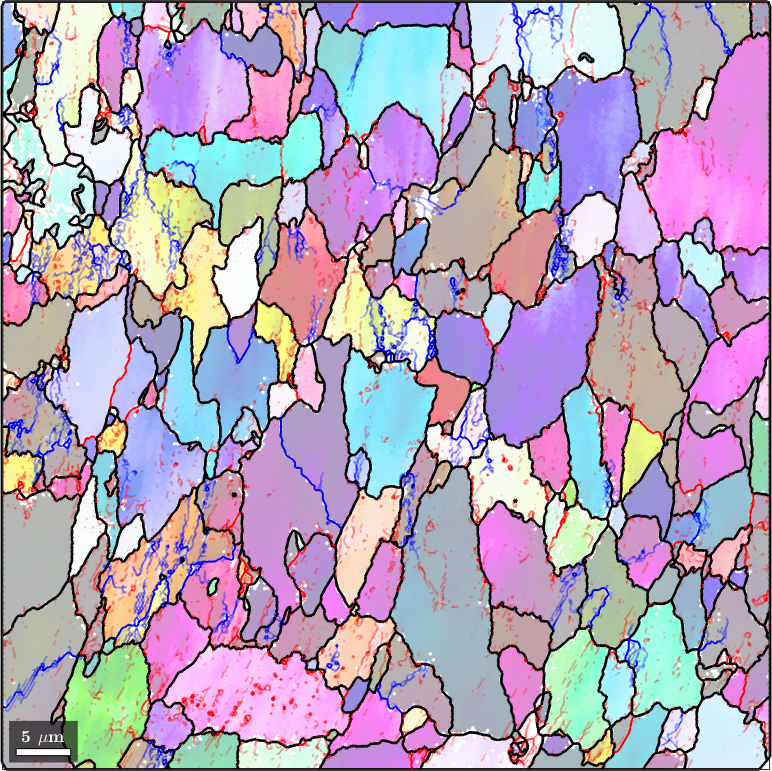
Sometimes one would like to distinguish between large connected networks of low-angle boundaries and singular disconnected segments. This can be done using the command componentSize. This command return for each segment the total number of segments it is connected with. In the following figure we use this to plot all low-angle grain boundary networks with more then 50 segments in blue and all remaining segments in red.
% plot the ebsd data
plot(ebsd('indexed'),ebsd('indexed').orientations,'faceAlpha',0.5,'figSize','large')

% distinguish between large connected networks and single segments
ind = grains.innerBoundary.componentSize > 50;

% plot the boundaries
hold on
plot(grains.boundary,'linewidth',2)
plot(grains.innerBoundary(ind),'linewidth',1.5,'edgeAlpha',alpha(ind),'edgeColor','b');
plot(grains.innerBoundary(~ind),'linewidth',1.5,'edgeAlpha',alpha(~ind),'edgeColor','r');
hold off