TODO: Please help to extend this section
Let us consider the uncorrelated misorientation distribution function corresponding to our model ODF.
mtexdata titanium

odf = calcDensity(ebsd.orientations)
ebsd = EBSD (y↑→x)
Phase Orientations Mineral Color Symmetry Crystal reference frame
0 8100 (100%) Titanium (Alpha) LightSkyBlue 622 X||a, Y||b*, Z||c*
Properties: ci, grainid, iq, sem_signal
Scan unit : um
X x Y x Z : [0, 996] x [0, 998] x [0, 0]
Normal vector: (0,0,1)
odf = SO3FunHarmonic (Titanium (Alpha) → y↑→x)
bandwidth: 25
weight: 1% the uncorrelated misorientation density function
mdf = calcMDF(odf)mdf = SO3FunHarmonic (Titanium (Alpha) → Titanium (Alpha))
antipodal: true
bandwidth: 25
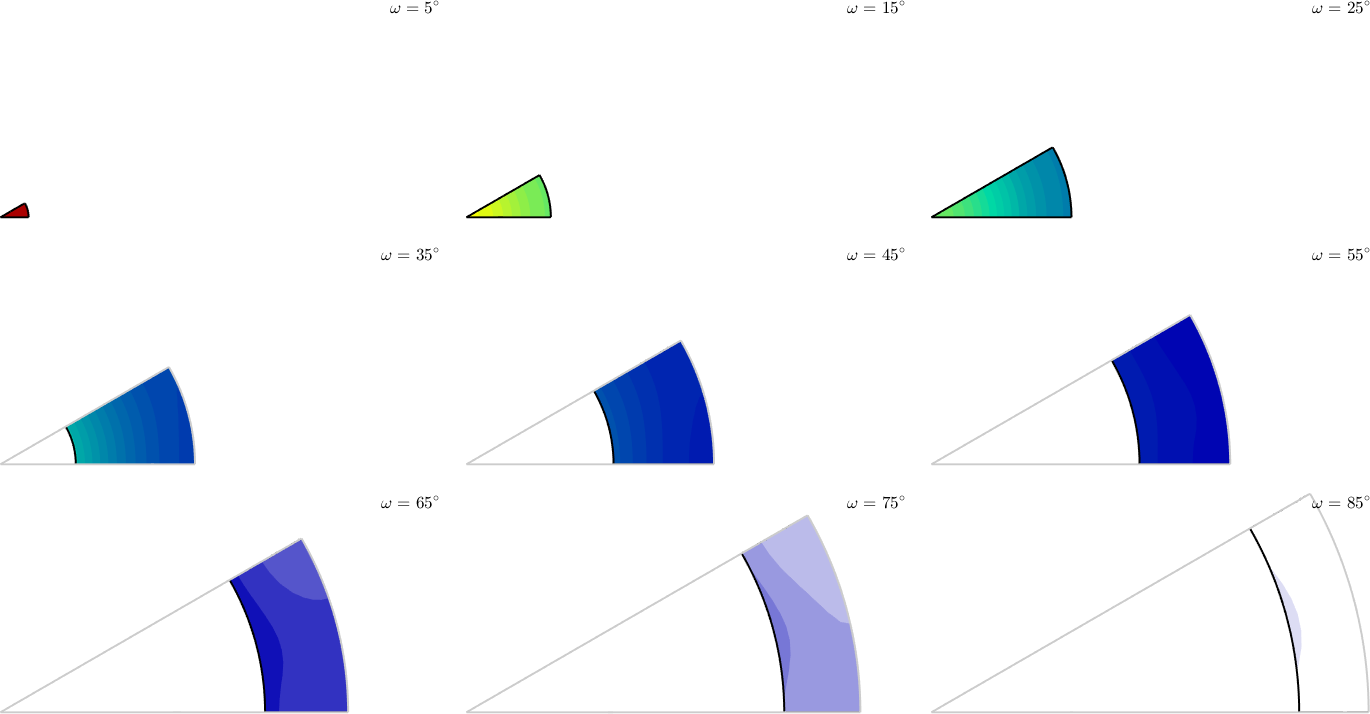
weight: 1plotSection(mdf,'axisAngle')
Axis / Angle Distribution
Then we can plot the distribution of the rotation axes of this misorientation ODF
plotAxisDistribution(mdf)
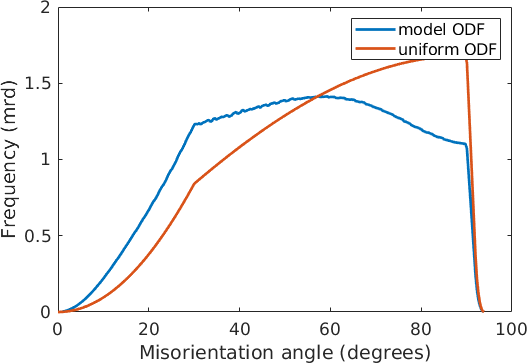
and the distribution of the misorientation angles and compare them to a uniform ODF
close all
plotAngleDistribution(mdf)
hold on
plotAngleDistribution(ebsd.CS,ebsd.CS)
hold off
legend('model ODF','uniform ODF')