Here we discuss tools for the analysis of EBSD data which are independent of its spatial coordinates. For spatial analysis, we refer to this page. Let us first import some EBSD data:
mtexdata forsterite silent

plot(ebsd)
Orientation plot
We start our investigations of the Forsterite phase by plotting some pole figures
cs = ebsd('Forsterite').CS % the crystal symmetry of the forsterite phase
h = [Miller(1,0,0,cs),Miller(0,1,0,cs),Miller(0,0,1,cs)];
plotPDF(ebsd('Forsterite').orientations,h,'antipodal')
cs = crystalSymmetry
mineral : Forsterite
color : LightSkyBlue
symmetry: mmm
elements: 8
a, b, c : 4.8, 10, 6
I'm plotting 1250 random orientations out of 152345 given orientations
You can specify the the number points by the option "points".
The option "all" ensures that all data are plotted
From the {100} pole figure, we might suspect a fibre texture present in our data. Let's check this. First, we determine the vector orthogonal to fibre in the {100} pole figure
% the orientations of the Forsterite phase
ori = ebsd('Forsterite').orientations
% the vectors in the 100 pole figure
r = ori * Miller(1,0,0,ori.CS)

% the vector best orthogonal to all r
rOrth = perp(r)

% output
plot(rOrth,'add2all','Marker','square','markerColor','DarkRed')
ori = orientation (Forsterite → y↑→x)
size: 152345 x 1
r = vector3d (y↑→x)
size: 152345 x 1
rOrth = vector3d (y↑→x)
antipodal: true
x y z
0.944141 -0.189955 0.269287
we can check how large is the number of orientations that are in the (100) pole figure within a 10-degree fibre around the great circle with center rOrth, i.e., in the region bounded by the two small circles
nextAxis(1)
circle(rOrth,80 * degree,'lineColor','darkred','linewidth',5,'EdgeAlpha',0.5)
The following line gives the result in percent
100 * sum(angle(r,rOrth)>80*degree) / length(ori)ans =
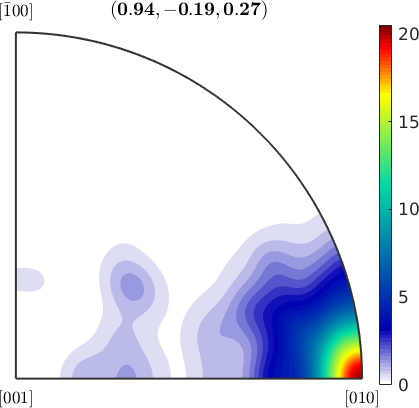
61.7854Next, we want to answer the question which crystal direction is mapped to rOrth. To this end, we look at the corresponding inverse pole figure
plotIPDF(ebsd('Forsterite').orientations,rOrth,'smooth')
mtexColorbar
From the inverse pole figure, it becomes clear that the orientations are close to the fibre Miller(0,1,0), rOrth. Let's check this by computing the fibre volume in percent
% define the fibre
f = fibre(Miller(0,1,0,cs),rOrth);

% compute the volume along the fibre
100 * volume(ebsd('Forsterite').orientations,f,10*degree)
ans =
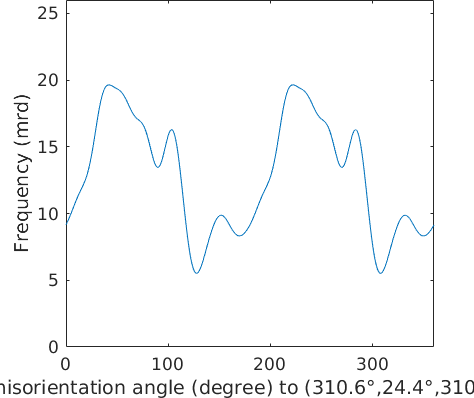
27.9806Surprisingly this value is significantly lower than the value we obtained we looking only at the 100 pole figure. Finally, let's plot the ODF along this fibre
odf = calcDensity(ebsd('Forsterite').orientations)

% plot the odf along the fibre
plot(odf,f,'linewidth',2)
ylim([0,26])
odf = SO3FunHarmonic (Forsterite → y↑→x)
bandwidth: 25
weight: 1
We see that to ODF is far from being constant along the fibre. Thus, together with an observation about the small fibre volume, we would reject the hypothesis of a fibre texture.
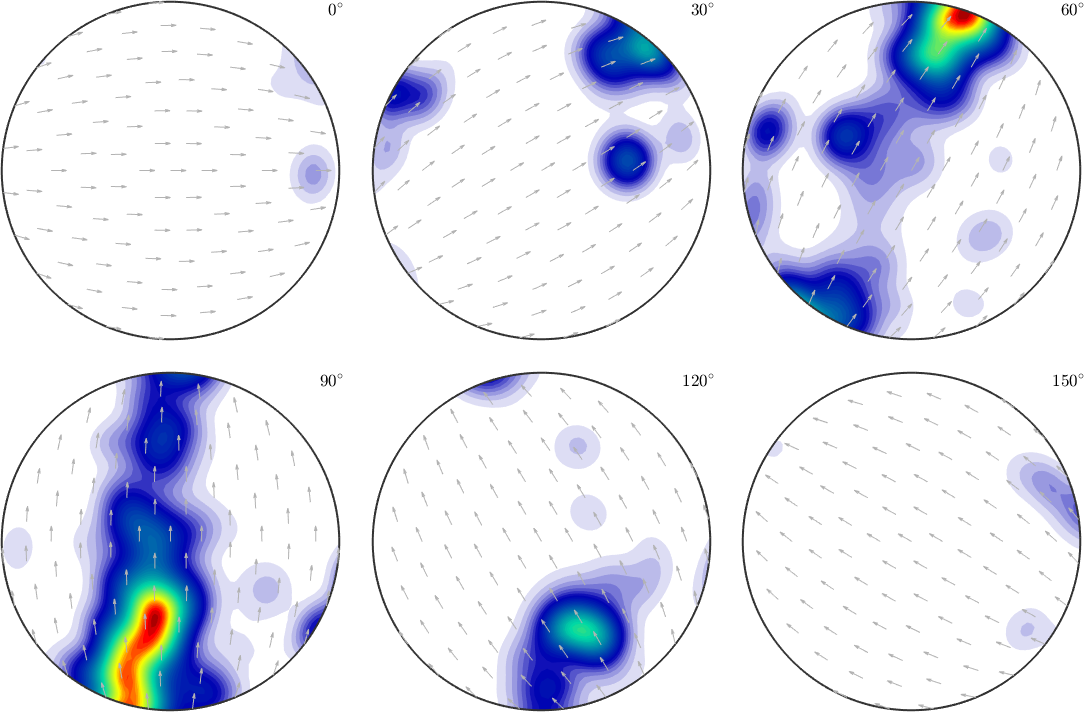
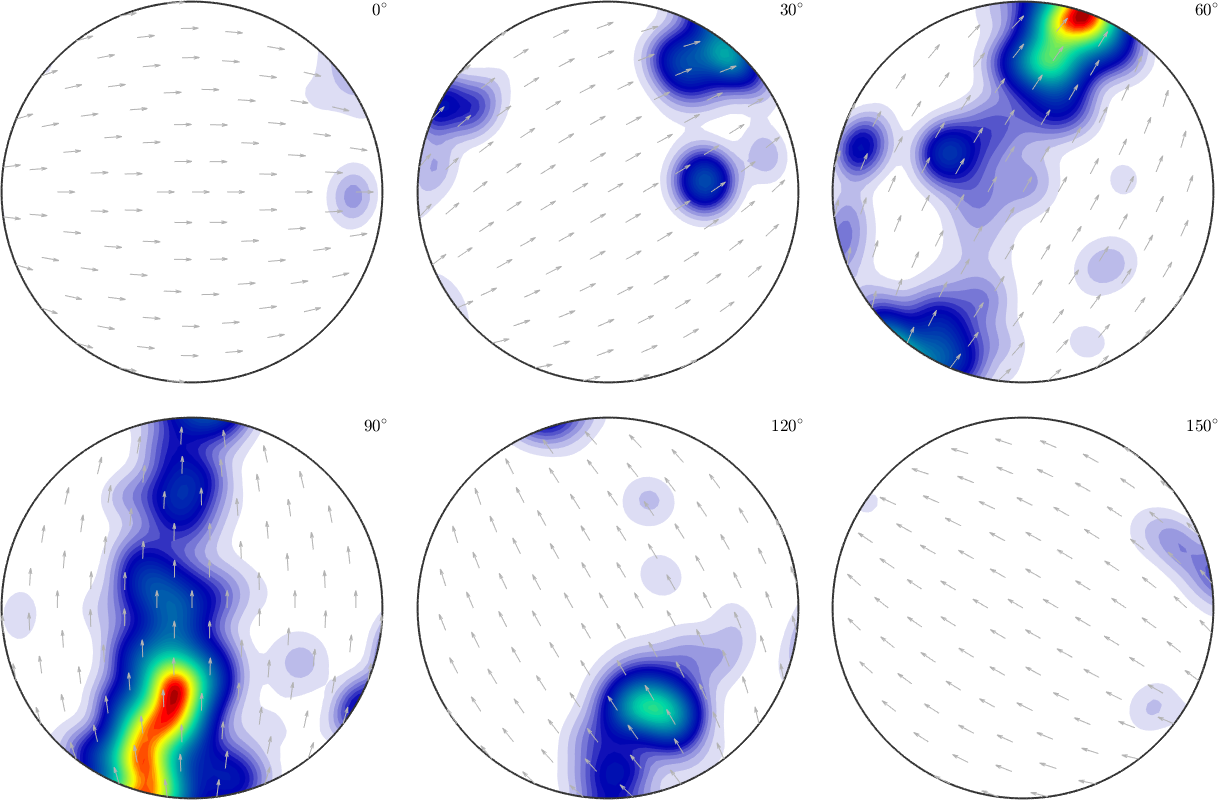
Let's finally plot the ODF in orientation space to verify our decision
plot(odf,'sigma')
Here we see the typical large individual spots that are typical for large grains. Thus the ODF estimated from the EBSD data and all our previous analysis suffer from the fact that too few grains have been measured. For texture analysis, it would have been favorable to measure at a lower resolution but a larger region.