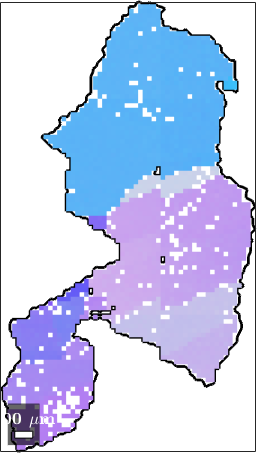
When analyzing texture gradients it is sometime helpful to look at the EBSD data restricted to a single line and plot profiles of certain properties along this line. In order to illustrate this at an example let us import some EBSD data, reconstruct grains and select the grain with the largest GOS (grain orientation spread) for further analysis.
close all
mtexdata forsterite silent

% reconstruct grains
[grains,ebsd.grainId,ebsd.mis2mean] = calcGrains(ebsd('indexed'));

% find the grain with maximum grain orientation spread
[~,id] = max(grains.GOS);
grain_selected = grains(id)

% plot the grain with its orientations
close all
plot(grain_selected.boundary,'linewidth',2)
hold on
plot(ebsd(grain_selected),ebsd(grain_selected).orientations)
hold off
grain_selected = grain2d (y↑→x)
Phase Grains Pixels Mineral Symmetry Crystal reference frame
1 1 2614 Forsterite mmm
boundary segments: 458 (20261 µm)
inner boundary segments: 48 (2152 µm)
triple points: 28
Id Phase Pixels meanRotation GOS
1856 1 2614 (153°,109°,246°) 0.17005
Next we specify a line segment through the grain
% line segment
lineSec =  [18826   6438; 18089 10599];

% draw the line into the plot
line(lineSec(:,1),lineSec(:,2),'linewidth',2)
The command spatialProfile restricts the EBSD data to this line
ebsd_line = spatialProfile(ebsd(grain_selected),lineSec)ebsd_line = EBSD (y↑→x)
Phase Orientations Mineral Color Symmetry Crystal reference frame
1 83 (100%) Forsterite LightSkyBlue mmm
Properties: bands, bc, bs, error, mad, grainId, mis2mean
Scan unit : um
X x Y x Z : [18100, 18800] x [6450, 10600] x [0, 0]
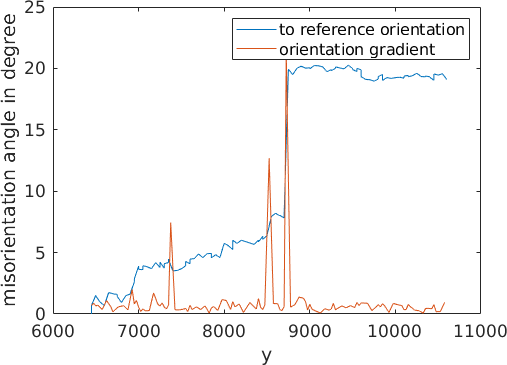
Normal vector: (0,0,1)Next, we plot the misorientation angle to the first point of the line as well as the orientation gradient
close all % close previous plots

% misorientation angle to the first orientation on the line
plot(ebsd_line.y,...
  angle(ebsd_line(1).orientations,ebsd_line.orientations)/degree)

% misorientation gradient
hold all
plot(0.5*(ebsd_line.y(1:end-1)+ebsd_line.y(2:end)),...
  angle(ebsd_line(1:end-1).orientations,ebsd_line(2:end).orientations)/degree)
hold off

xlabel('y'); ylabel('misorientation angle in degree')

legend('to reference orientation','orientation gradient')
We can also plot the orientations along this line into inverse pole figures and colorize them according to their y-coordinate
close
plotIPDF(ebsd_line.orientations,[xvector,yvector,zvector],...
  'property',ebsd_line.y,'markersize',20,'antipodal')

mtexColorbar