EBSD data is usually acquired on a regular grid. Hence, even over a finite number of grid points, all possible grain boundary directions can not be uniquely represented. One way of overcoming this problem - and also allowing to compute grid-independent curvatures and grain boundary directions - is the interpolation of grain boundary coordinates using grains.smooth.
Proper smoothing has an influence on measures such as total grain boundary length, grain boundary curvature, triple point angles or grain boundary directions among others.
While we used grains.smooth before, here we will illustrate the different options.
mtexdata csl
[grains, ebsd.grainId] = ebsd.calcGrains('minPixel',3);

% the data was acquired on a regular grid;
plot(ebsd,ebsd.orientations,'micronbar','off')
hold on
plot(grains.boundary('indexed'),'linewidth',5,'linecolor','YellowGreen')
hold off
axis([313 353 140 156])
ebsd = EBSD (y↑→x)
Phase Orientations Mineral Color Symmetry Crystal reference frame
0 5 (0.0032%) notIndexed
-1 154107 (100%) iron LightSkyBlue m-3m
Properties: ci, error, iq
Scan unit : um
X x Y x Z : [0, 511] x [0, 300] x [0, 0]
Normal vector: (0,0,1)
With the default parameters we have the following result
% smooth the grains with default parameters
grains_smooth = smooth(grains);

hold on
plot(grains_smooth.boundary('indexed'),'linewidth',2)
hold off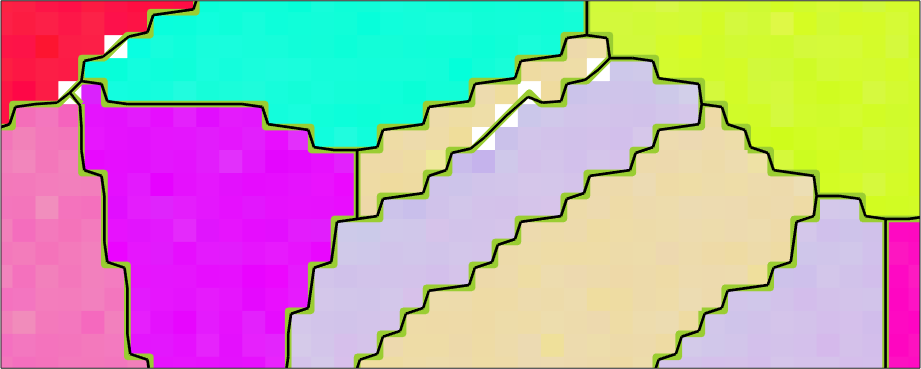
The grain boundary boundaries look now a little bit more smooth and the total grain boundary length is reasonable reduced.
sum(grains.boundary('indexed').segLength)
sum(grains_smooth.boundary('indexed').segLength)
ans =
1.9437e+04
ans =
1.7230e+04However, if we look at the frequency distribution of grain boundary segments, we find that some angle are over-represented which is due to the fact that without any additional input argument, grains.smooth performs just a single iteration
histogram(grains_smooth.boundary('indexed').direction, ...
  'weights',grains_smooth.boundary('indexed').segLength,180)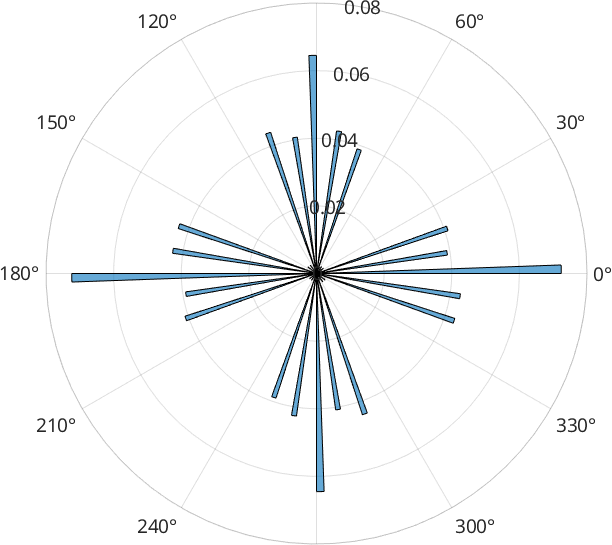
Effect of smoothing iterations
If we specify a larger number of iterations, we can see that the scatting around 0 and 90 degree decreases.
iter = [1 5 10 25];
color = copper(length(iter)+1);
plot(grains.boundary,'linewidth',1,'linecolor','Fuchsia')
d={};
for i = 1:length(iter)
  grains_smooth = smooth(grains,iter(i));
  hold on
  plot(grains_smooth.boundary('i','i'),'linewidth',2,'linecolor',color(i,:))
  d{i} = grains_smooth.boundary('i','i').direction;
end
hold off
axis([313 353 140 156])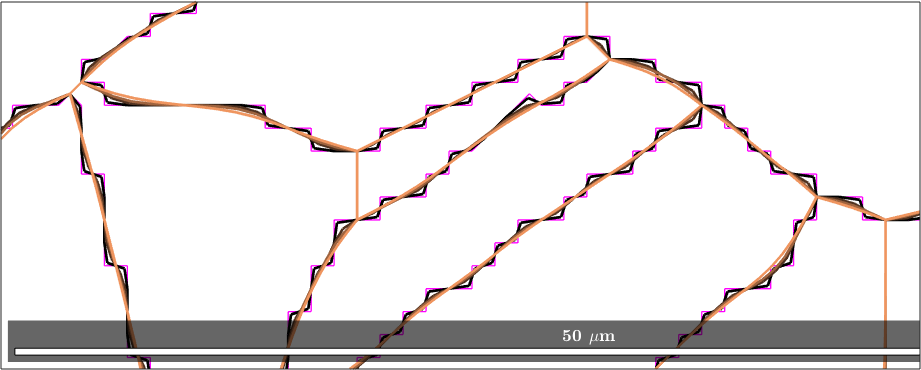
We can compare the histogram of the grain boundary directions of the entire map.
figure
for i=1:length(d)
  subplot(2,2,i)
  histogram(d{i}, 'weights',norm(d{i}),180)
end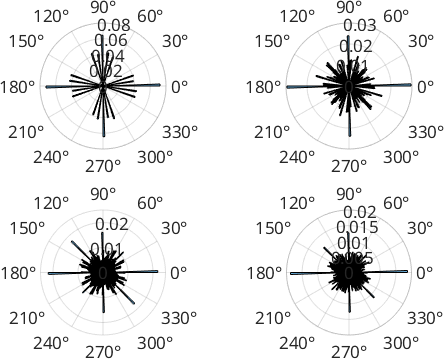
Note that we are still stuck with many segments at 0 and 90 degree positions which is due to the boundaries in question being too short for the sample size to deviate from the grid.
grains.smooth usually keeps the triple junction positions locked. However, sometimes it is necessary (todo) to allow triple junctions to move.
plot(grains.boundary,'linewidth',1,'linecolor','Fuchsia')
for i = 1:length(iter)
  grains_smooth = smooth(grains,iter(i),'moveTriplePoints');
  hold on
  plot(grains_smooth.boundary('i','i'),'linewidth',2,'linecolor',color(i,:))
  d{i} = grains_smooth.boundary('i','i').direction;
end
hold off
axis([313 353 140 156])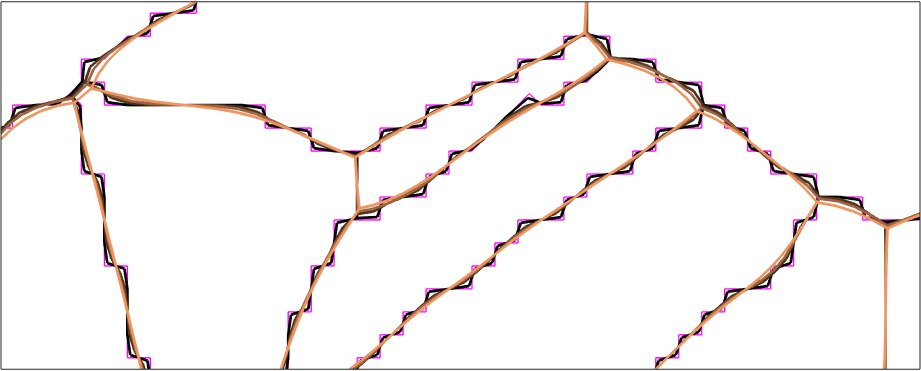
Comparing the grain boundary direction histograms shows that we suppressed the gridding effect even a little more.
figure
for i=1:length(d)
   subplot(2,2,i)
   histogram(d{i}, 'weights',norm(d{i}),180)
end
Be careful since this allows small grains to shrink with increasing number of smoothing iterations
Todo: different smoothing algorithms and 2nd order