In this section we discuss basic geometric properties of grains. Due to the huge amount of shape parameters we split them into different categories: basic properties (this page), properties based on fitted ellipses, convex hull bases properties, projection bases properties. The table below summarizes the shape parameters discussed on this page.
|
numPixel |
number of pixels per grain |
grain area in µm² |
|
|
number of boundary segments |
perimeter in µm |
||
|
number of inner boundaries |
length of inner boundaries in µm |
||
|
diameter in µm |
caliper or Feret diameter |
||
|
perimeter of a circle with the same area |
radius of a circle with the same area |
||
|
perimeter / equivalent perimeter |
is it a boundary grain |
||
|
irregularity of grain boundary |
|
|
|
|
has inclusions |
is an inclusions |
||
|
number neighboring grains |
list of triple points |
||
|
list of boundary segments |
subgrain boundaries |
||
|
x, y |
coordinates of the vertices |
x,y coordinates of the barycenter |
We start our discussion by reconstructing the grain structure from a sample EBSD data set.
% load sample EBSD data set
mtexdata forsterite silent

% restrict it to a subregion of interest.
ebsd = ebsd(inpolygon(ebsd,[5 2 10 5]*10^3));

% remove all not indexed pixels
ebsd = ebsd('indexed');

% reconstruct grains
[grains, ebsd.grainId] = calcGrains(ebsd,'angle',5*degree,'minPixel',5);

% smooth them
grains = smooth(grains,5);

% plot the orientation data of the Forsterite phase
plot(ebsd('fo'),ebsd('fo').orientations)

% plot the grain boundary on top of it
hold on
plot(grains.boundary,'lineWidth',2)
hold off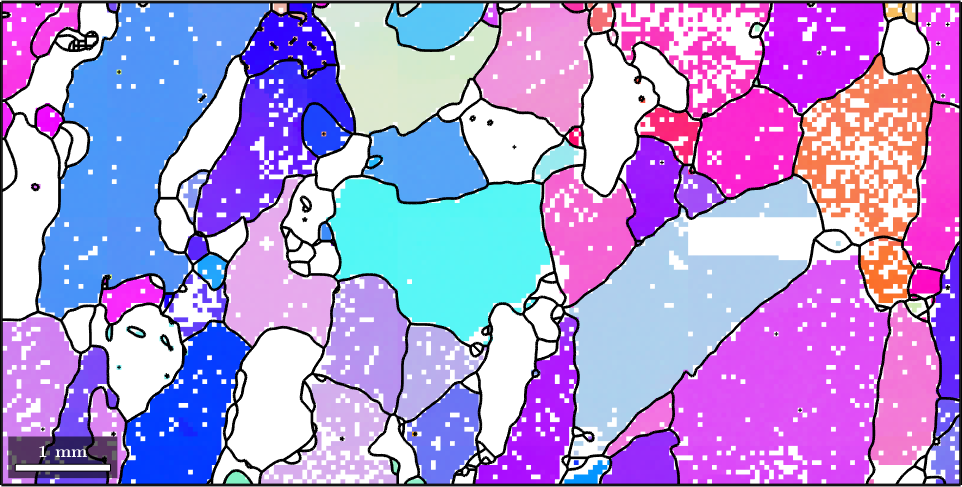
Grain size vs. grain area and boundary size vs. perimeter
The most basic properties are number of pixels and grain area. Those can be computed by
grains(9).numPixel
grains(9).area
ans =
6
ans =
2.9453e+04Hereby numPixel refers to the number of pixels that belong to a certain grain while area represents the actual area measured in (µm)^2. We may analyze the distribution of grains by grain area using a histogram.
close all
histogram(grains.area)
xlabel('grain area')
ylabel('number of grains')
Note the large amount of very small grains. A more realistic histogram we obtain if we do not plot the number of grains at the y-axis but its total area. This can be achieved with the command histogram(grains) or hist(grains)
hist(grains)ans =
0.5294 0.8078 0.9804
ans =
0.5608 0.7373 0.5608
ans =
0.8549 0.6471 0.1255
histogram(grains)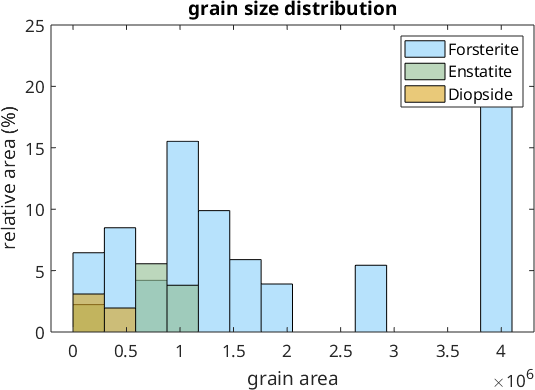
Similarly as numPixel and area, the one-dimensional measures boundarySize and perimeter give the length of the grain boundary as number of segments and in µm, respectively.
grains(9).boundarySize
grains(9).perimeter
ans =
20
ans =
876.2182We may compute these quantities also explicitly from the grain boundary segments. In the following code the first command returns simply the number of boundary segments while the second one gives the total length of the boundary by summing up the length of each individual boundary segment
length(grains(9).boundary)
sum(grains(9).boundary.segLength)
ans =
20
ans =
876.2182Radius, diameter, equivalent radius, equivalent perimeter and shape factor
Another, one dimensional measure is the diameter which refers to the longest distance between any two boundary points and is given im µm as well
grains(9).diameterans =
412.3106The diameter is a special case of the caliper or Feret diameter of a grain that is explained in detail in the section Projection based parameters.
In contrast the equivalent radius is the radius of a circle with the same area as the grain. Naturally, the equivalent radius is always smaller than the actual radius of the grains. Similarly, the equivalent perimeter is defined as the perimeter of the circle the same area and is always smaller then the actual perimeter.
2*grains(9).equivalentRadius

grains(9).equivalentPerimeter
ans =
193.6504
ans =
608.3708As a consequence, the ratio between between actual grain perimeter and the equivalent perimeter, the so called shape factor, is always larger then 1. The shapeFactor and measures how different a certain shape is from a circle.
plot(grains,grains.shapeFactor)
mtexColorbar('title','shape factor')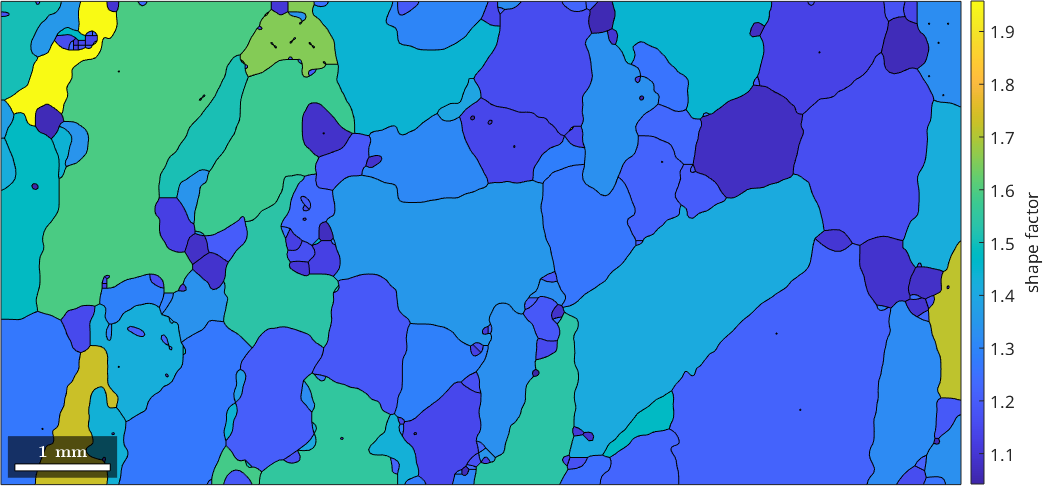
A second measure for the discrepancy between the actual shape and a circle is the relative difference between the perimeter and the equivalentPerimeter
plot(grains,(grains.perimeter - grains.equivalentPerimeter)./grains.perimeter)
setColorRange([0,0.5])
mtexColorbar
In this plot round shapes will have values close to zero while concave shapes will get values up to \(0.5\).
A third measure is the paris which stands for Percentile Average Relative Indented Surface and gives the relative difference between the actual perimeter and the perimeter of the convex hull. It is explained in more detail in the section convex hull parameters.
plot(grains,grains.paris)
mtexColorbar('title','paris')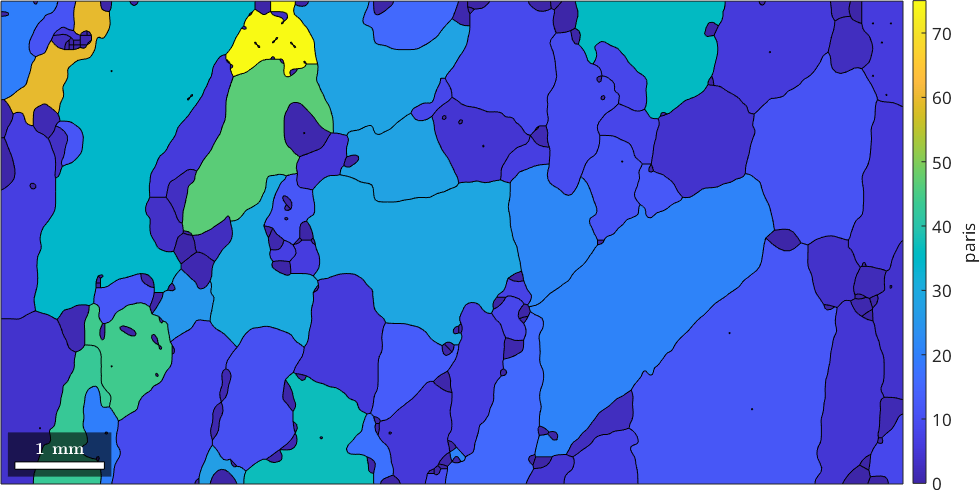
Fractal Dimension
The fractal dimension of grain boundaries has been used to characterize the conditions of dynamical recrystallization. One way to define the fractal dimension of grain boundaries is to look at the slope of the perimeter as a function of the equivalent radius of the grains. More precisely, we consider this relationship in a log log plot and fit a linear model.
% consider the entire data set
mtexdata forsterite silent

% reconstruct grains
grains = calcGrains(ebsd('indexed'));

% smooth them
grains = smooth(grains,5);

close all
scatter(grains.equivalentRadius,grains.perimeter)
xlabel('equivalent radius')
ylabel('perimeter')

% set axes to logarithmic
logAxis(gca, [10,10^4],[10^2,10^5])

% fit a linear function in log space
ab = polyfit(log(grains.equivalentRadius),log(grains.perimeter),1);

% plot it
hold on
plot([10,10^4],exp(ab(2) + ab(1) * log([10,10^4])),'LineWidth',3)
hold off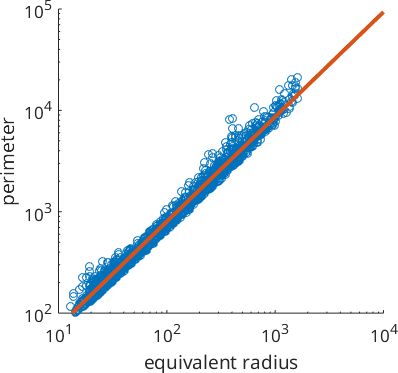
The slope of the linear function is the fractal dimension.
fractalDimension = ab(1)fractalDimension =
1.0330It is important to understand that the fractal dimension computed this way heavily depends on the smoothing applied to the grain boundaries.