MTEX supports a wide varity of spherical grids. Those include the regularS2Grid, the MTEX equispaced grid, the HealPix grid and the Fibonacci grid. Lets define them with an resulution of 7 degrees
% the regular grid
grid{1} = regularS2Grid('resolution',7*degree);

% the MTEX equispaced grid
grid{2} = equispacedS2Grid('resolution',7*degree);

% the HealPix grid
grid{3} = HEALPixS2Grid('resolution',7*degree);

% and the Fibonaci Grid
grid{4} = fibonacciS2Grid('resolution',7*degree);

% store the names of the grids
names = {'regular','equispaced','HealPix','Fibonaci'};
Plotting them indicates that there are quite some differences, especially close to the poles.
plot(grid{1},'upper','layout',[2,2])
mtexTitle(names{1})

for k = 2:4
  nextAxis
  plot(grid{k},'upper')
  mtexTitle(names{k})
end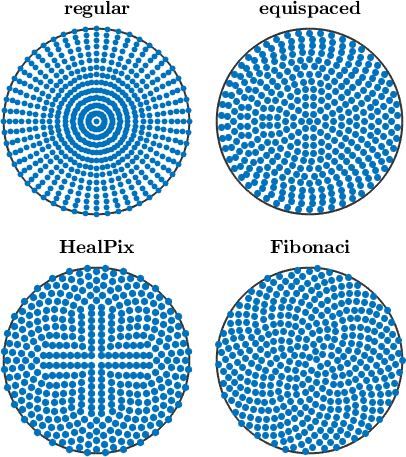
Comparison of Uniformity
In order to compare the uniformity of the different grids we first perform a density estimation.
for k = 1:4
  d(k) = calcDensity(grid{k},'halfwidth',5*degree);
end

clf
for k = 1:4
  plot(d(k),'upper','layout',[2,2]);
  mtexTitle(names{k})
  if k<4, nextAxis, end
end
mtexColorbar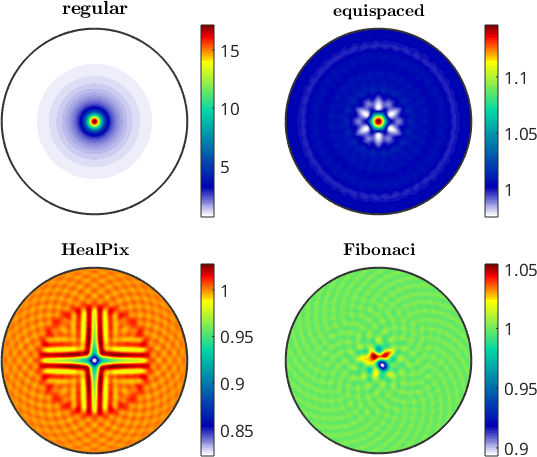
We visually observe that there are quite some differences between the grids. We may also quantify the different to the uniform distribution by computing
norm(d-1).'ans =
4.0141 0.031724 0.042597 0.020115or
sum(abs(d-1)).'ans =
5.7668
0.059956
0.067368
0.032026