Theory
For an orientation distribution function (ODF) \(f \colon \mathrm{SO}(3) \to R\) the pole density function \(P_{\vec h}\) with respect to a fixed crystal direction \(\vec h\) is spherical function defined as the integral
\[ P_{\vec h}(\vec r) = \int_{g \vec h = \vec r} f(g) dg \]
The pole density function \(P_{\vec h}(\vec r)\) evaluated at a specimen direction \(\vec r\) can be interpreted as the volume percentage of crystals with the crystal lattice planes \(\vec h\) beeing normal to the specimen direction \(\vec r\).
In order to illustrate the concept of pole figures at an example lets us first define some model ODFs to be plotted later on.
cs = crystalSymmetry('32');
mod1 = orientation.byEuler(90*degree,40*degree,110*degree,'ZYZ',cs);
mod2 = orientation.byEuler(50*degree,30*degree,-30*degree,'ZYZ',cs);

odf = 0.2*unimodalODF(mod1) ...
  + 0.3*unimodalODF(mod2) ...
  + 0.5*fibreODF(Miller(0,0,1,cs),vector3d(1,0,0),'halfwidth',10*degree);

% and lets switch to the LaboTex colormap
setMTEXpref('defaultColorMap',LaboTeXColorMap);
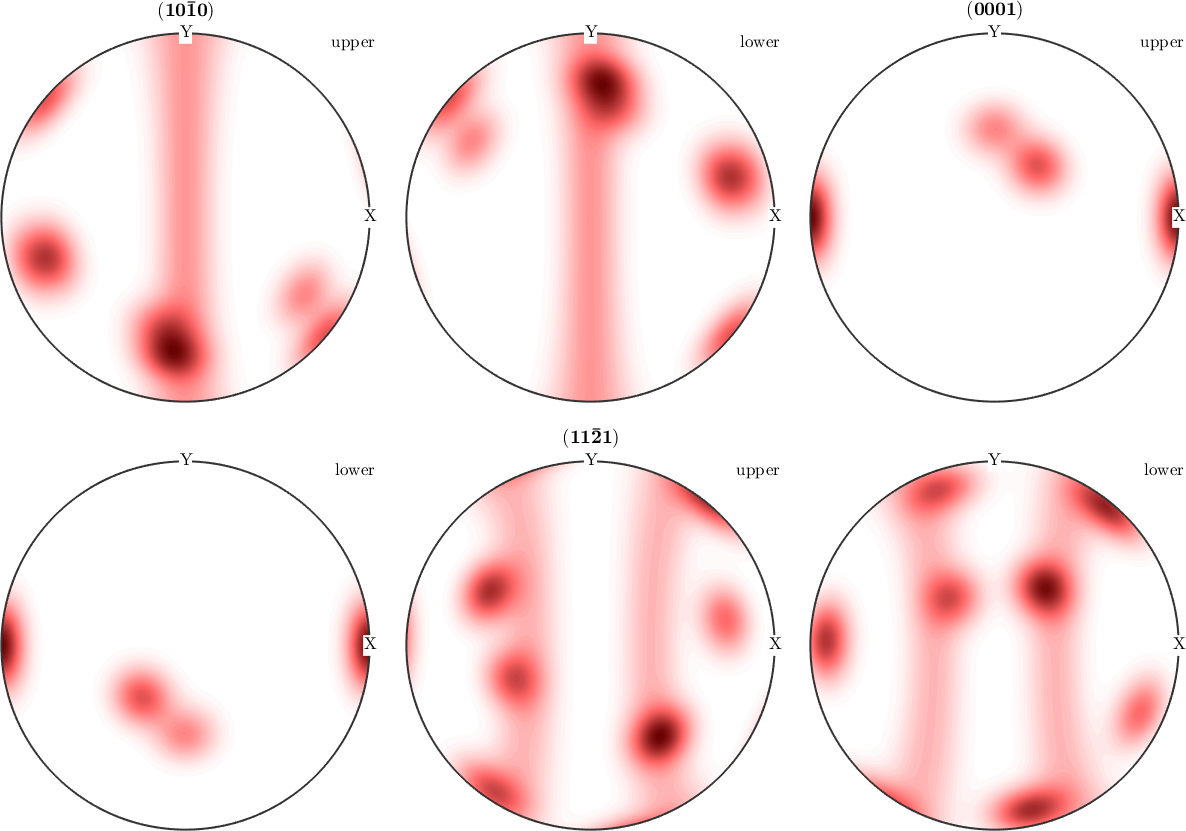
Plotting some pole figures of an ODF is straight forward using the plotPDF command. The only mandatory arguments are the ODF to be plotted and the Miller indice of the crystal directions you want to have pole figures for
plotPDF(odf,Miller({1,0,-1,0},{0,0,0,1},{1,1,-2,1},cs))
While the first two pole figures are plotted on the upper hemisphere only the (11-21) has been plotted for the upper and lower hemisphere. The reason for this behaviour is that MTEX automatically detects that the first two pole figures coincide on the upper and lower hemisphere while the (11-21) pole figure does not. In order to plot all pole figures with upper and lower hemisphere we can do
plotPDF(odf,Miller({1,0,-1,0},{0,0,0,1},{1,1,-2,1},cs),'complete')
We see that in general upper and lower hemisphere of the pole figure do not coincide. This is only the case if one one following reason is satisfied
- the crystal direction \(h\) is symmetrically equivalent to \(-h\), in the present example this is true for the c-axis \(h = (0001)\)
- the symmetry group contains the inversion, i.e., it is a Laue group
- we consider experimental pole figures where we have antipodal symmetry, due to Friedel's law.
In MTEX antipodal symmetry can be enforced by the use the option 'antipodal'.
plotPDF(odf,Miller(1,1,-2,1,cs),'antipodal','complete')
Evaluation of the corresponding pole figure or inverse pole figure is done using the command calcPDF.
odf.calcPDF(Miller(1,0,0,cs),xvector)ans =
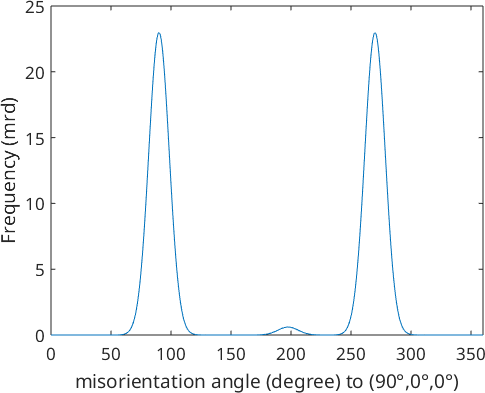
0.1982For a more complex example let us define a fibre and plot the ODF along this fibre.
f = fibre(Miller(1,0,0,odf.CS),yvector);

close all
plotFibre(odf,f)
Finally, lets set back the default colormap.
setMTEXpref('defaultColorMap',WhiteJetColorMap);