Miller indices are used to describe directions with respect to the crystal reference system.
Crystal Lattice Directions
Since lattice directions are always subject to a certain crystal reference frame, the starting point for any crystal direction is the definition of a variable of type crystalSymmetry.
cs = crystalSymmetry('triclinic',[5.29,9.18,9.42],[90.4,98.9,90.1]*degree,...
  'X||a*','Z||c','mineral','Talc');
The variable cs contains the geometry of the crystal reference frame and, in particular, the alignment of the crystallographic \(\vec a\), \(\vec b\), and, \(\vec c\) axis.
a = cs.aAxis
b = cs.bAxis
c = cs.cAxis
a = Miller (Talc)
u v w
1 0 0
b = Miller (Talc)
u v w
0 1 0
c = Miller (Talc)
u v w
0 0 1A lattice direction \(\vec m = u \cdot \vec a + v \cdot \vec b + w \cdot \vec c\) is a vector with coordinates \(u\), \(v\), \(w\) with respect to these crystallographic axes. Such a direction is commonly denoted by \([uvw]\) with coordinates \(u\), \(v\), \(w\) called Miller indices. In MTEX a lattice direction is represented by a variable of type Miller which is defined by
m = Miller(1,0,1,cs,'uvw')m = Miller (Talc)
u v w
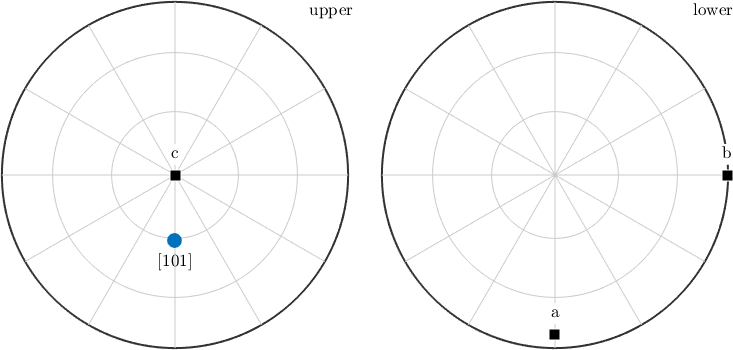
1 0 1for values \(u = 1\), \(v = 0\), and, \(w = 1\). To plot a crystal direction as a spherical projections do
plot(m,'labeled','grid')

annotate([a,b,c],'label',{'a','b','c'},'backgroundcolor','w','textAboveMarker')
Note that for triclinic and monoclinic symmetries MTEX aligns spherical projections of crystal directions such that the b-axis points towards east and c* points out of the plane. This behavior can be changed by altering the plotting convention stored in cs.how2plot. E.g. we might want to have the a-axis to point to east
% change the plotting convention
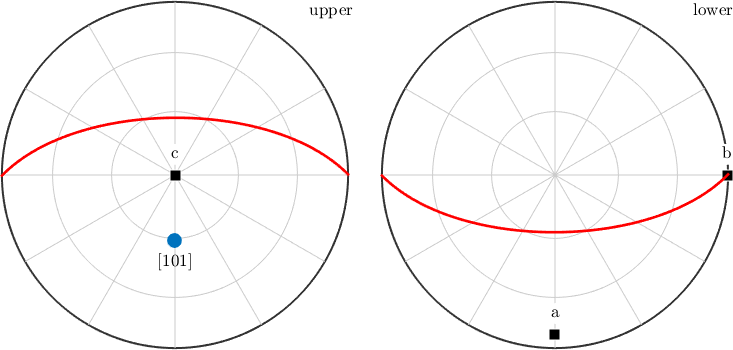
cs.how2plot.east = cs.aAxis;

plot(m,'labeled','grid')

annotate([a,b,c],'label',{'a','b','c'},'backgroundcolor','w','textAboveMarker')
Crystal Lattice Planes
A crystal lattice plane \((hkl)\) is commonly described by its normal vector \(\vec n = h \cdot \vec a^* + k \cdot \vec b^* + \ell \cdot \vec c^*\) where \(\vec a^*\), \(\vec b^*\) and \(\vec c^*\) describe the reciprocal crystal coordinate system. In MTEX a lattice plane is defined by
m = Miller(1,0,1,cs,'hkl')m = Miller (Talc)
h k l
1 0 1By default lattice planes are plotted as normal directions. Using the option 'plane' we may alternatively plot the trace of the lattice plane with the sphere.
hold on
% the normal direction
plot(m,'upper','labeled')

% the trace of the corresponding lattice plane
plot(m,'plane','linecolor','r','linewidth',2,'add2all')
hold off
Note that for non Euclidean crystal frames uvw and hkl notations usually lead to different directions.
Trigonal and Hexagonal Convention
In the case of trigonal and hexagonal crystal symmetry often four digit Miller indices \([UVTW]\) and \((HKIL)\) are used, as they make it more easy to identify symmetrically equivalent directions. This notation is redundant as the first three Miller indices always sum up to zero, i.e., \(U + V + T = 0\) and \(H + K + I = 0\). The syntax is
% import trigonal Quartz lattice structure
cs = loadCIF('quartz');

% a four digit lattice direction
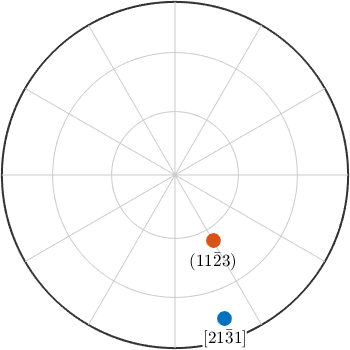
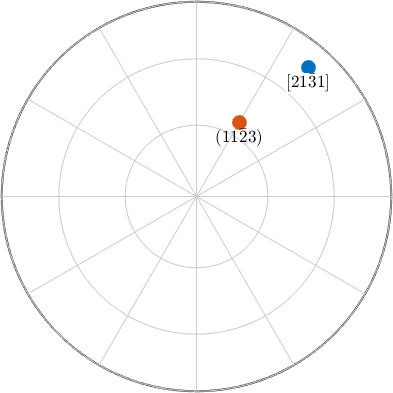
m = Miller(2,1,-3,1,cs,'UVTW')

% a four digit plane normal
n = Miller(1,1,-2,3,cs,'hkil')

plot(m,'upper','labeled','backgroundColor','white','grid','on')
hold on
plot(n,'upper','labeled')
hold off
m = Miller (Quartz)
U V T W
2 1 -3 1
n = Miller (Quartz)
h k i l
1 1 -2 3
In order to switch the output format, e.g. from UVTW to uvw do
m.dispStyle = 'uvw';
round(m)
ans = Miller (Quartz)
u v w
5 4 1or from reciprocal to direct coordinates
n.dispStyle = 'UVTW';
round(n)
ans = Miller (Quartz)
U V T W
3 3 -6 11Note, that this does not change the vector but only the display of the coefficients. Internally, all vectors are stored with respect to the cartesian coordinate system.