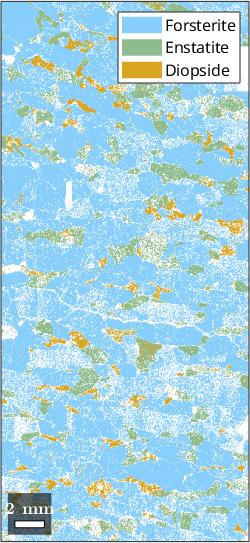
In this section we will calculate the elastic properties of an aggregate and plot its seismic properties in pole figures that can be directly compare to the pole figures for CPO
Let's first import an example dataset from the MTEX toolbox
mtexdata forsteriteebsd = EBSD (y↑→x)
Phase Orientations Mineral Color Symmetry Crystal reference frame
0 58485 (24%) notIndexed
1 152345 (62%) Forsterite LightSkyBlue mmm
2 26058 (11%) Enstatite DarkSeaGreen mmm
3 9064 (3.7%) Diopside Goldenrod 12/m1 X||a*, Y||b*, Z||c
Properties: bands, bc, bs, error, mad
Scan unit : um
X x Y x Z : [0, 36550] x [0, 16750] x [0, 0]
Normal vector: (0,0,1)This dataset consists of the three main phases, forsterite, Enstatite and Diopside. As we want to plot the seismic properties of this aggregate, we need (i) the modal proportions of each phase in this sample, (ii) their orientations, which is given by their ODFs, (iii) the elastic constants of the minerals and (iv) their densities. One can use the modal proportions that appear in the command window (ol=62%, en=11%, dio=4%), but there is a lot of non-indexed data. You can recalculate the data only for the indexed data
Correct EBSD spatial coordinates
This EBSD dataset has the foliation N-S, but standard CPO plots and physical properties in geoscience use an external reference frame where the foliation is vertical E-W and the lineation is also E-W but horizontal. We can correct the data by rotating the whole dataset by 90 degree around the z-axis
ebsd = rotation.byAxisAngle(zvector,-90*degree) * ebsd;

% we shall plot x to the north for a better screen fit
ebsd.how2plot.north = xvector;
plot(ebsd,'micronbar','off')
Import the elastic stiffness tensors
The elastic stiffness tensor of Forsterite was reported in Abramson et al., 1997 (Journal of Geophysical Research) with respect to the crystal reference frame
CS_Tensor_Fo = crystalSymmetry('222', [4.762 10.225 5.994],...
    'mineral', 'Forsterite', 'color', 'light red');
and the density in g/cm^3
rho_Fo = 3.3550;by the coefficients \(C_{ij}\) in Voigt matrix notation
Cij = [[320.5  68.15  71.6     0     0     0];...
  [ 68.15  196.5  76.8     0     0     0];...
  [  71.6   76.8 233.5     0     0     0];...
  [   0      0      0     64     0     0];...
  [   0      0      0      0    77     0];...
  [   0      0      0      0     0  78.7]];
In order to define the stiffness tensor as an MTEX variable we use the command stiffnessTensor.
C_Fo = stiffnessTensor(Cij,CS_Tensor_Fo,'density',rho_Fo);Note that when defining a single crystal tensor we shall always specify the crystal reference system which has been used to represent the tensor by its coordinates \(c_{ijkl}\).
Now we define the stiffness tensor of Enstatite, reported by Chai et al. 1997 (Journal of Geophysical Research)
% the crystal reference system
cs_Tensor_opx = crystalSymmetry('mmm',[ 18.2457  8.7984  5.1959],...
  [  90.0000  90.0000  90.0000]*degree,'x||a','z||c',...
  'mineral','Enstatite');

% the density
rho_opx = 3.3060;

% the tensor coefficients
Cij =....
  [[  236.90   79.60   63.20    0.00    0.00    0.00];...
  [    79.60  180.50   56.80    0.00    0.00    0.00];...
  [    63.20   56.80  230.40    0.00    0.00    0.00];...
  [     0.00    0.00    0.00   84.30    0.00    0.00];...
  [     0.00    0.00    0.00    0.00   79.40    0.00];...
  [     0.00    0.00    0.00    0.00    0.00   80.10]];

% define the tensor
C_opx = stiffnessTensor(Cij,cs_Tensor_opx,'density',rho_opx);
For Diopside coefficients where reported in Isaak et al., 2005 - Physics and Chemistry of Minerals)
% the crystal reference system
cs_Tensor_cpx = crystalSymmetry('121',[9.585  8.776  5.26],...
  [90.0000 105.8600  90.0000]*degree,'x||a*','z||c',...
  'mineral','Diopside');

% the density
rho_cpx = 3.2860;

% the tensor coefficients
Cij =....
  [[  228.10   78.80   70.20    0.00    7.90    0.00];...
  [    78.80  181.10   61.10    0.00    5.90    0.00];...
  [    70.20   61.10  245.40    0.00   39.70    0.00];...
  [     0.00    0.00    0.00   78.90    0.00    6.40];...
  [     7.90    5.90   39.70    0.00   68.20    0.00];...
  [     0.00    0.00    0.00    6.40    0.00   78.10]];

% define the tensor
C_cpx = stiffnessTensor(Cij,cs_Tensor_cpx,'density',rho_cpx);
Single crystal seismic velocities
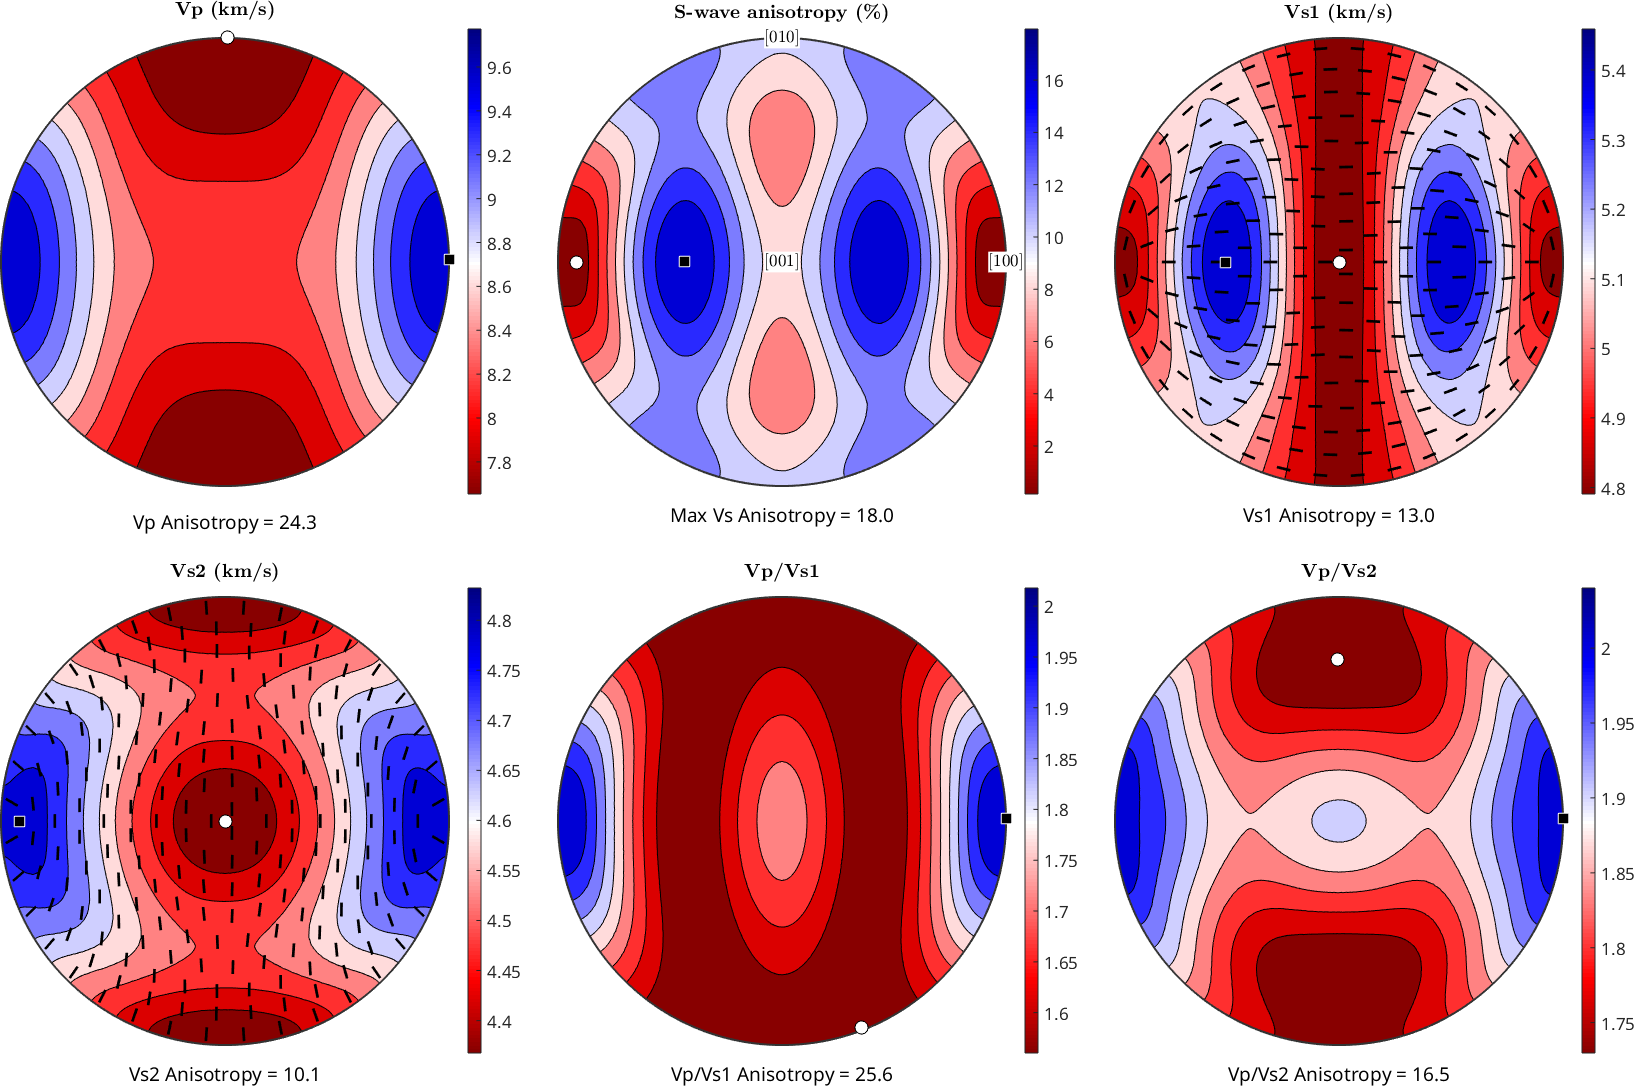
The single crystal seismic velocities can be computed by the command velocity and are explained in more detail here. At this point we simply use the command plotSeismicVelocities to get an overview of the single crystal seismic properties.
plotSeismicVelocities(C_Fo)

% lets add the crystal axes to the second plot
nextAxis(1,2)
hold on
text(Miller({1,0,0},{0,1,0},{0,0,1},CS_Tensor_Fo),...
  {'[100]','[010]','[001]'},'backgroundColor','w')
hold off
Bulk elastic tensor from EBSD data
Combining the EBSD data and the single crystal stiffness tensors we can estimate an bulk stiffness tensor by computing Voigt, Reuss or Hill averages. Tensor averages are explained in more detail in this section. Here we use the command calcTensor
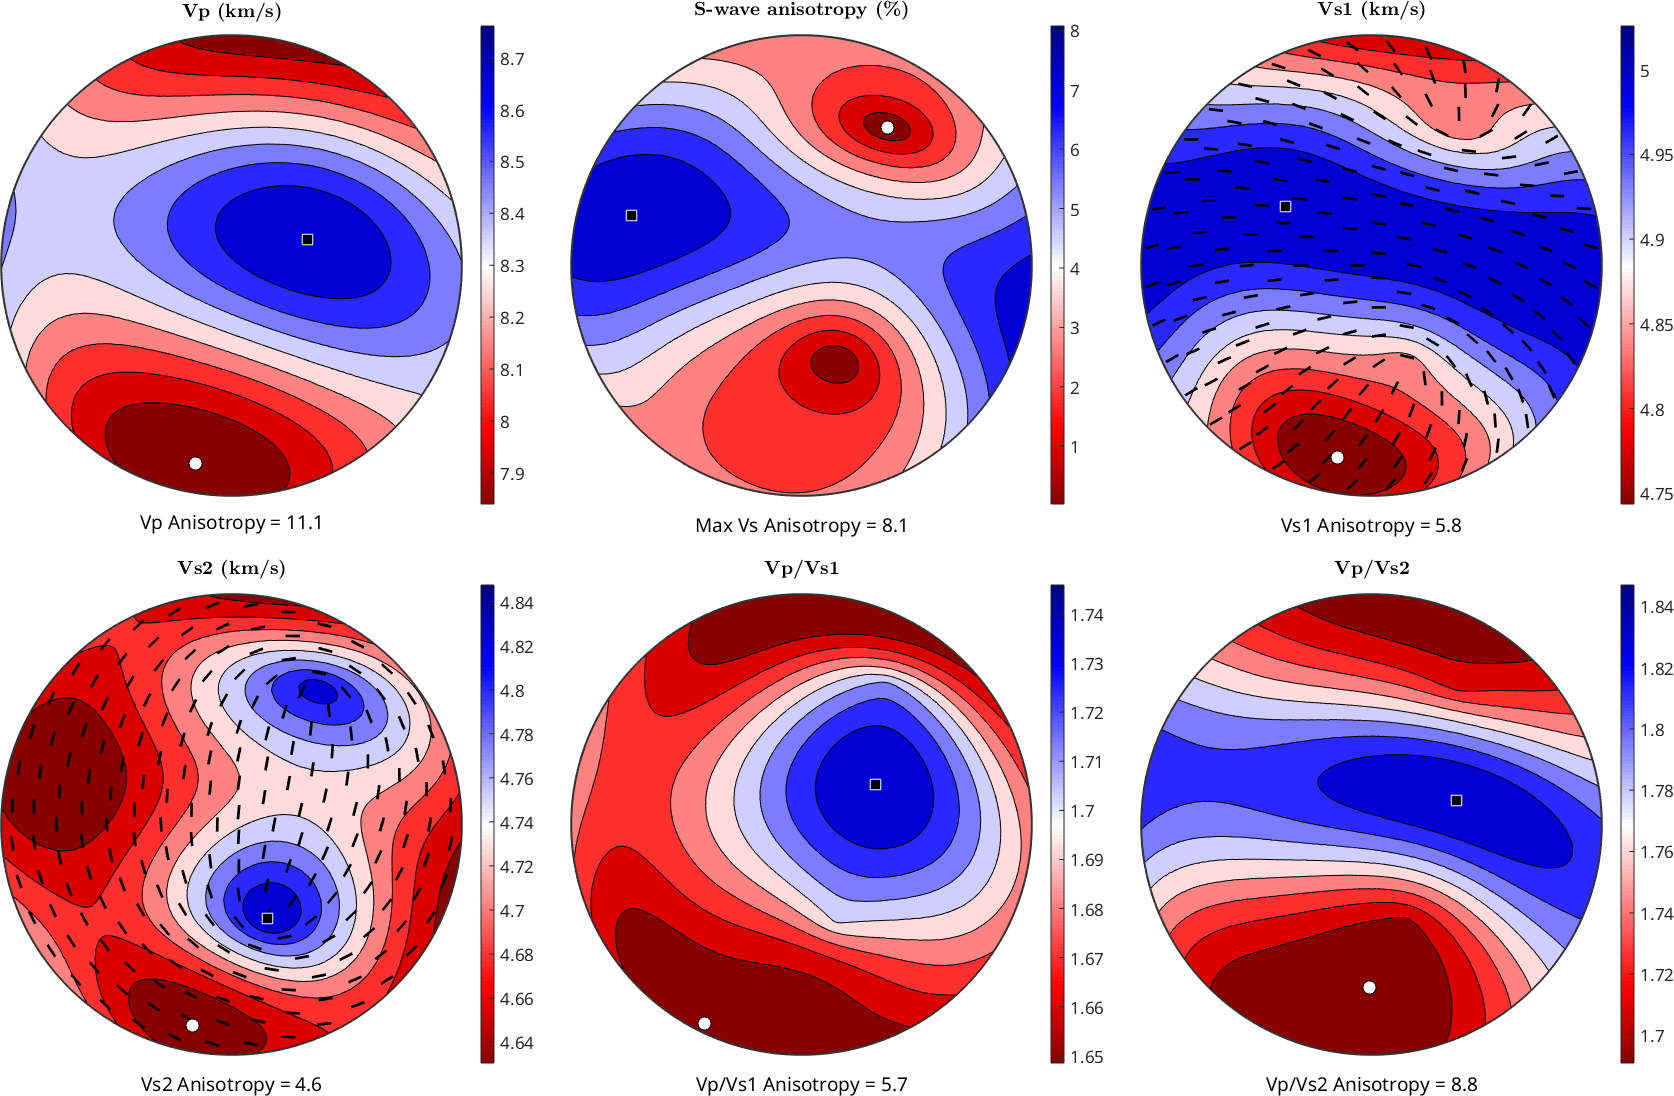
[CVoigt, CReuss, CHill] = calcTensor(ebsd,C_Fo,C_opx,C_cpx);For visualizing the polycrystal wave velocities we again use the command plotSeismicVelocities
plotSeismicVelocities(CHill)
Bulk elastic tensor from ODFs
For large data sets the computation of the average stiffness tensor from the EBSD data might be slow. In such cases it can be faster to first estimate an ODF for each individual phase
odf_ol = calcDensity(ebsd('f').orientations,'halfwidth',10*degree);
odf_opx = calcDensity(ebsd('e').orientations,'halfwidth',10*degree);
odf_cpx = calcDensity(ebsd('d').orientations,'halfwidth',10*degree);
Note that you do don't need to write the full name of each phase, only the initial, that works when phases start with different letters. Also note that although we use an EBSD dataset in this example, you can perform the same calculations with CPO data obtain by other methods (e.g. x-ray/neutron diffraction) as you only need the ODF variable for the calculations
To calculate the average stiffness tensor from the ODFs we first compute them from each phase separately
[CVoigt_ol, CReuss_ol, CHill_ol]    = mean(C_Fo,odf_ol);
[CVoigt_opx, CReuss_opx, CHill_opx] = mean(C_opx,odf_opx);
[CVoigt_cpx, CReuss_cpx, CHill_cpx] = mean(C_cpx,odf_cpx);
and then take their average weighted according the volume of each phase
vol_ol  = length(ebsd('f')) ./ length(ebsd('indexed'));
vol_opx = length(ebsd('e')) ./ length(ebsd('indexed'));
vol_cpx = length(ebsd('d')) ./ length(ebsd('indexed'));

[CVoigt, CReuss, CHill] = mean([CVoigt_ol, CVoigt_opx, CVoigt_cpx],...
  'weights',[vol_ol, vol_opx, vol_cpx]);

CHill
CHill = stiffnessTensor (y←↑x)
density: 3.3449
unit : GPa
rank : 4 (3 x 3 x 3 x 3)
tensor in Voigt matrix representation:
241.93 74.34 78.25 0.71 4.68 -3.15
74.34 210.34 73.7 3.59 -0.56 -1.83
78.25 73.7 252.19 6.46 4.61 -0.32
0.71 3.59 6.46 76.84 -0.41 1.65
4.68 -0.56 4.61 -0.41 84.87 2.19
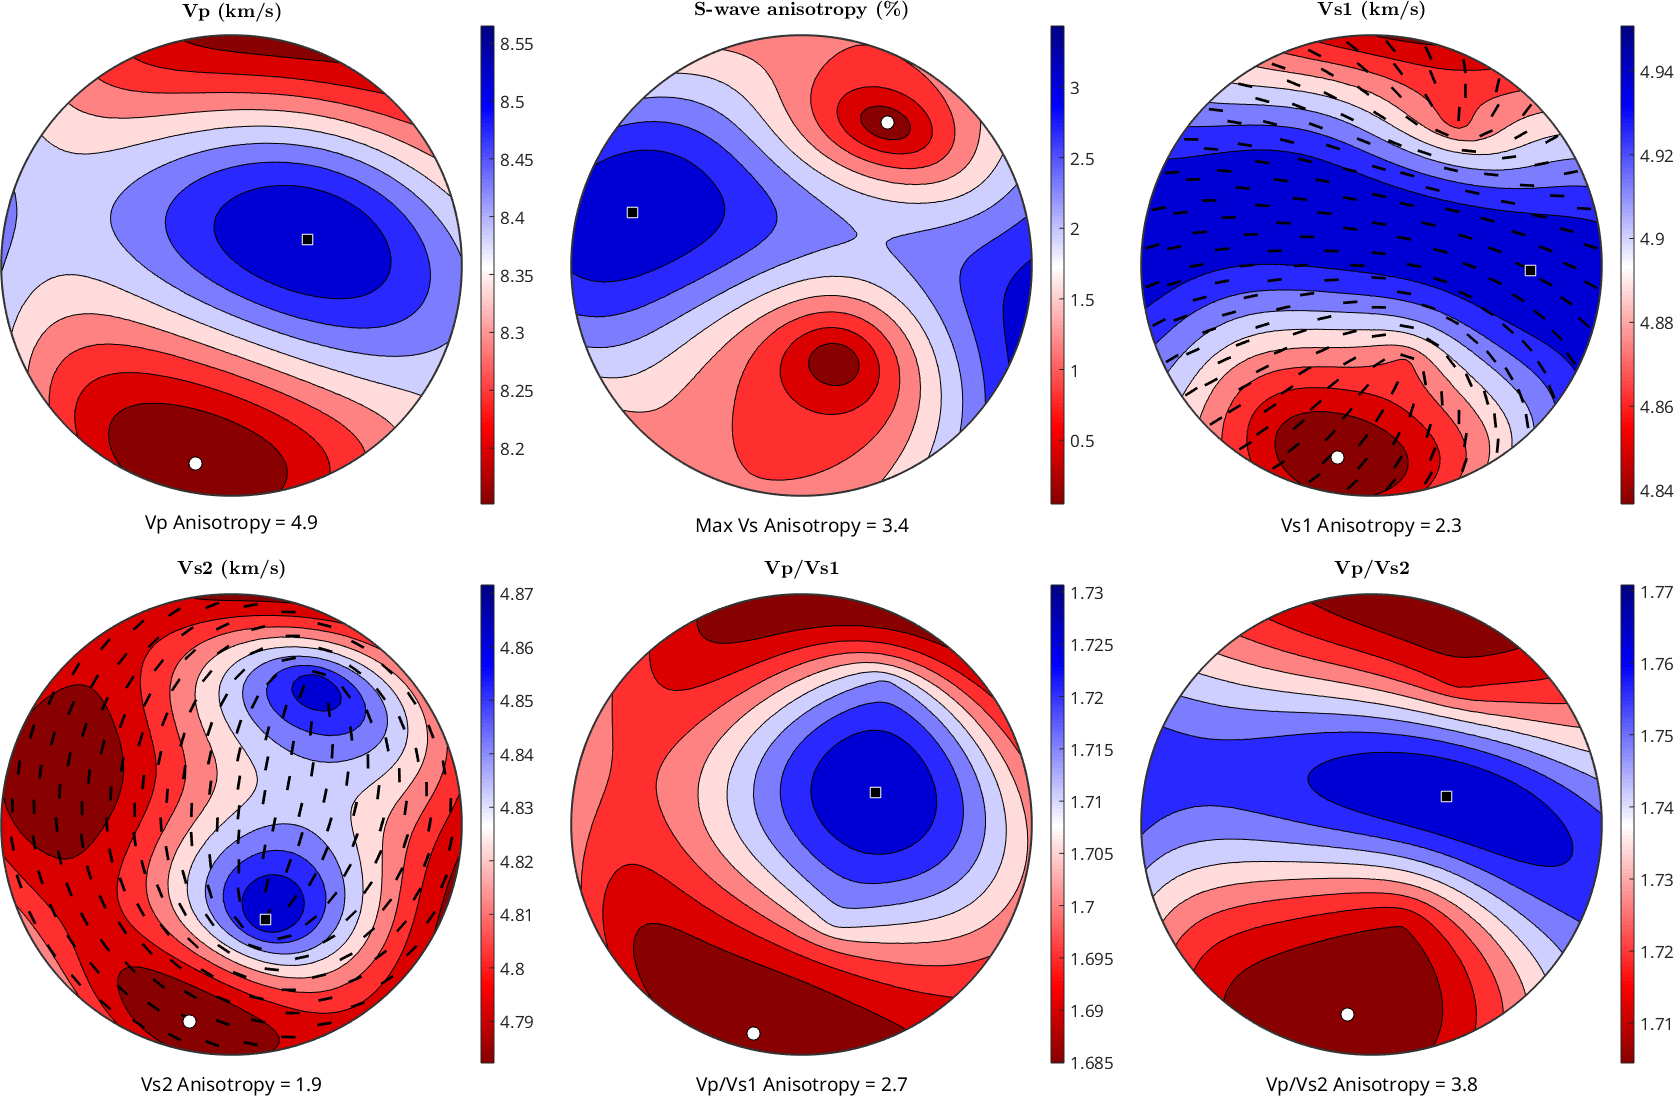
-3.15 -1.83 -0.32 1.65 2.19 74.49Finally, we visualize the polycrystal wave velocities as above
plotSeismicVelocities(CHill)