Euler angle space
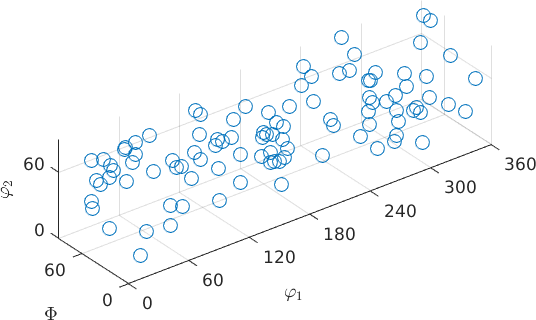
By default the function plot plots orientations in the three dimensional Bunge Euler angle space
cs = crystalSymmetry('cubic')

ori = orientation.rand(100,cs);
plot(ori)
cs = crystalSymmetry
symmetry: m-3m
elements: 48
a, b, c : 1, 1, 1
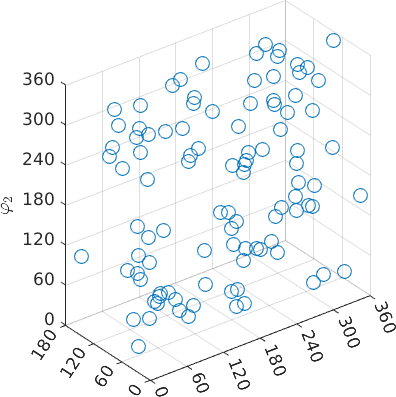
Note that the orientations are automatically projected into the fundamental region. In the case of cubic symmetry this means that the Euler angles \(\Phi\) and \(\phi_2\) are restricted to 90 degrees. If the orientations should be plotted at their specified Euler angles the option 'ignoreFundamentalRegion' has to be used.
plot(ori,'ignoreFundamentalRegion')
Axis angle space
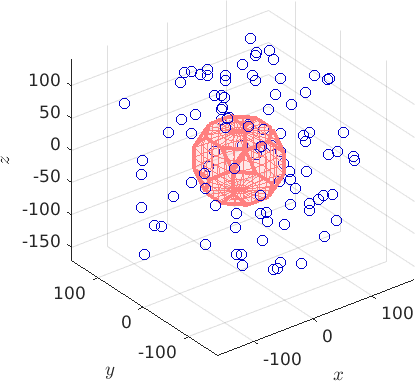
Alternatively, orientations can be plotted in the three dimensional axis angle space.
plot(ori,'AxisAngle','markerEdgeColor',[0 0 0.8],'markerSize',8)
The orientations are automatically projected into its fundamental region. Again, this can be switched off with the option 'ignoreFundamentalRegion'.
plot(ori,'axisAngle','ignoreFundamentalRegion','markerEdgeColor',[0 0 0.8],'markerSize',8)

% visualize the fundamental region
hold on
oR = fundamentalRegion(ori.CS,ori.SS)
plot(oR,'color',[1 0.5 0.5]),
hold off
oR = orientationRegion
crystal symmetry: 432
max angle: 62.7994°
face normales: 14
vertices: 24