spatial EBSD plot
Syntax
% colorize according to phase
plot(ebsd)
% colorize according to arbitrary value - here MAD
plot(ebsd,ebsd.mad)% colorize according to orientation
plot(ebsd('phaseName'),ebsd('phaseName').orientation)% colorize according to custom color
oM = ipfColorKey(ebsd('phaseName'))
color = oM.orientation2color(ebsd('phaseName').orientations);
plot(ebsd('phaseName'),color)% specify the color directly and show in Legend
badMAD = ebsd.mad > 1;
plot(ebsd(badMAD),'faceColor','black,'DisplayName','bad values')% plot a subregion
plot(ebsd,ebsd.orientation,'region',[xmin, xmax, ymin, ymax])Input
| ebsd | EBSD |
| color | length(ebsd) x 3 vector of RGB values |
Options
| micronbar | 'on'/'off' |
| DisplayName | add a legend entry |
| region | [xmin, xmax, ymin, ymax] plotting region |
Flags
| points | plot dots instead of unitcells |
| exact | plot exact unitcells, even for large maps |
Example
mtexdata forsterite
plot(ebsd)
ebsd = EBSD (y↑→x)
Phase Orientations Mineral Color Symmetry Crystal reference frame
0 58485 (24%) notIndexed
1 152345 (62%) Forsterite LightSkyBlue mmm
2 26058 (11%) Enstatite DarkSeaGreen mmm
3 9064 (3.7%) Diopside Goldenrod 12/m1 X||a*, Y||b*, Z||c
Properties: bands, bc, bs, error, mad
Scan unit : um
X x Y x Z : [0, 36550] x [0, 16750] x [0, 0]
Normal vector: (0,0,1)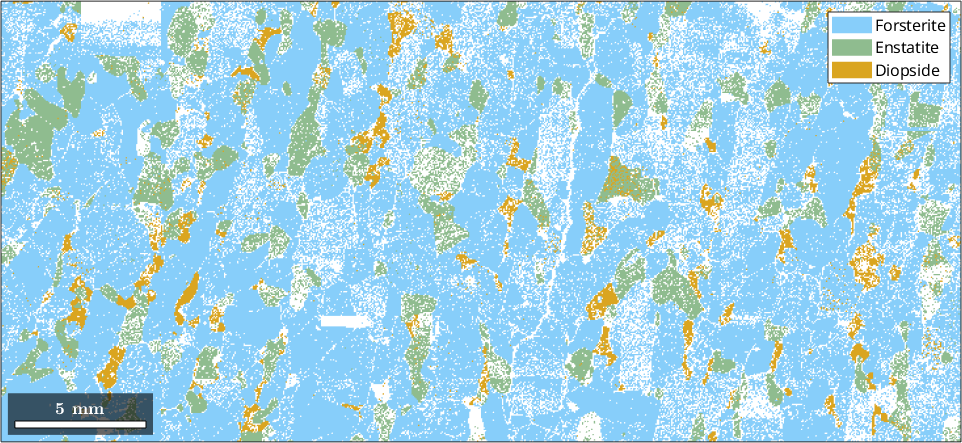
colorize according to orientations
plot(ebsd('Forsterite'),ebsd('Forsterite').orientations)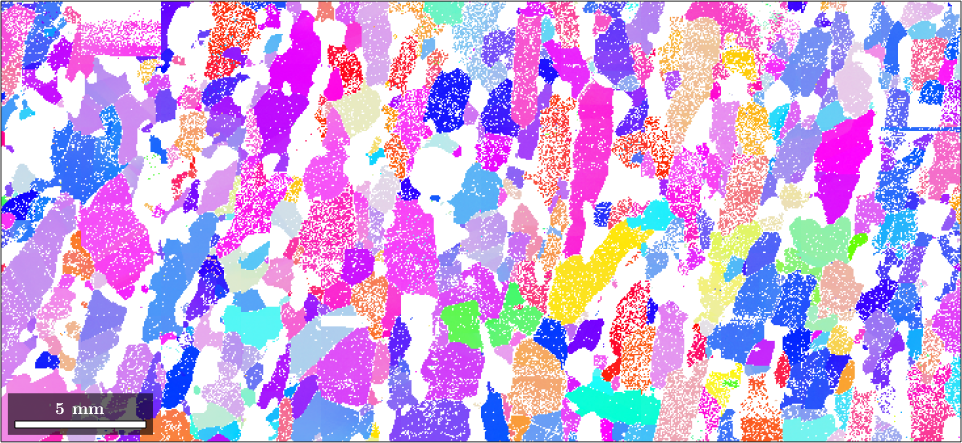
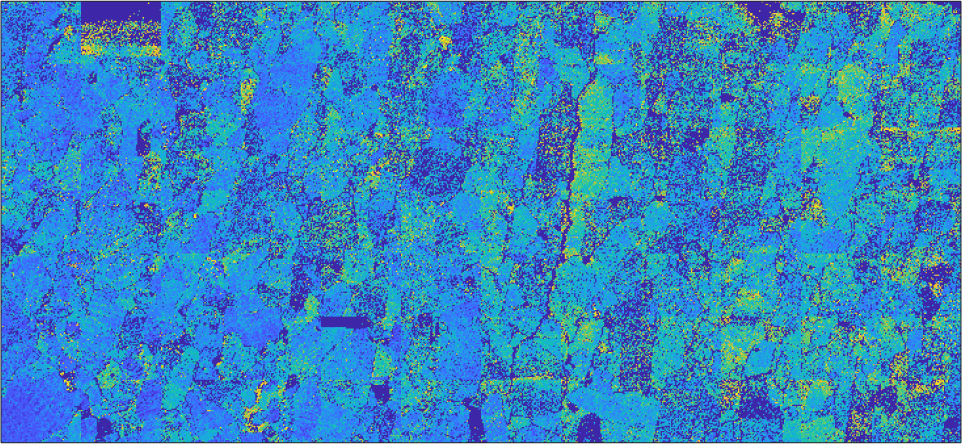
colorize according to MAD
plot(ebsd,ebsd.mad,'micronbar','off')