ODFSECTIONS Summary of this class goes here Detailed explanation goes here
Syntax
oS = ODFSections(CS1,varargin)Example
cs = crystalSymmetry('222')
oS = axisAngleSections(cs,cs);
ori = oS.makeGrid('resolution',2.5*degree);
oM = PatalaColorKey(cs,cs)
rgb = oM.orientation2color(ori);
plot(oS,rgb,'surf')
cs = crystalSymmetry
symmetry: 222
elements: 4
a, b, c : 1, 1, 1
oM =
PatalaColorKey with properties:
CS1: [1×1 crystalSymmetry]
CS2: [1×1 crystalSymmetry]
antipodal: 1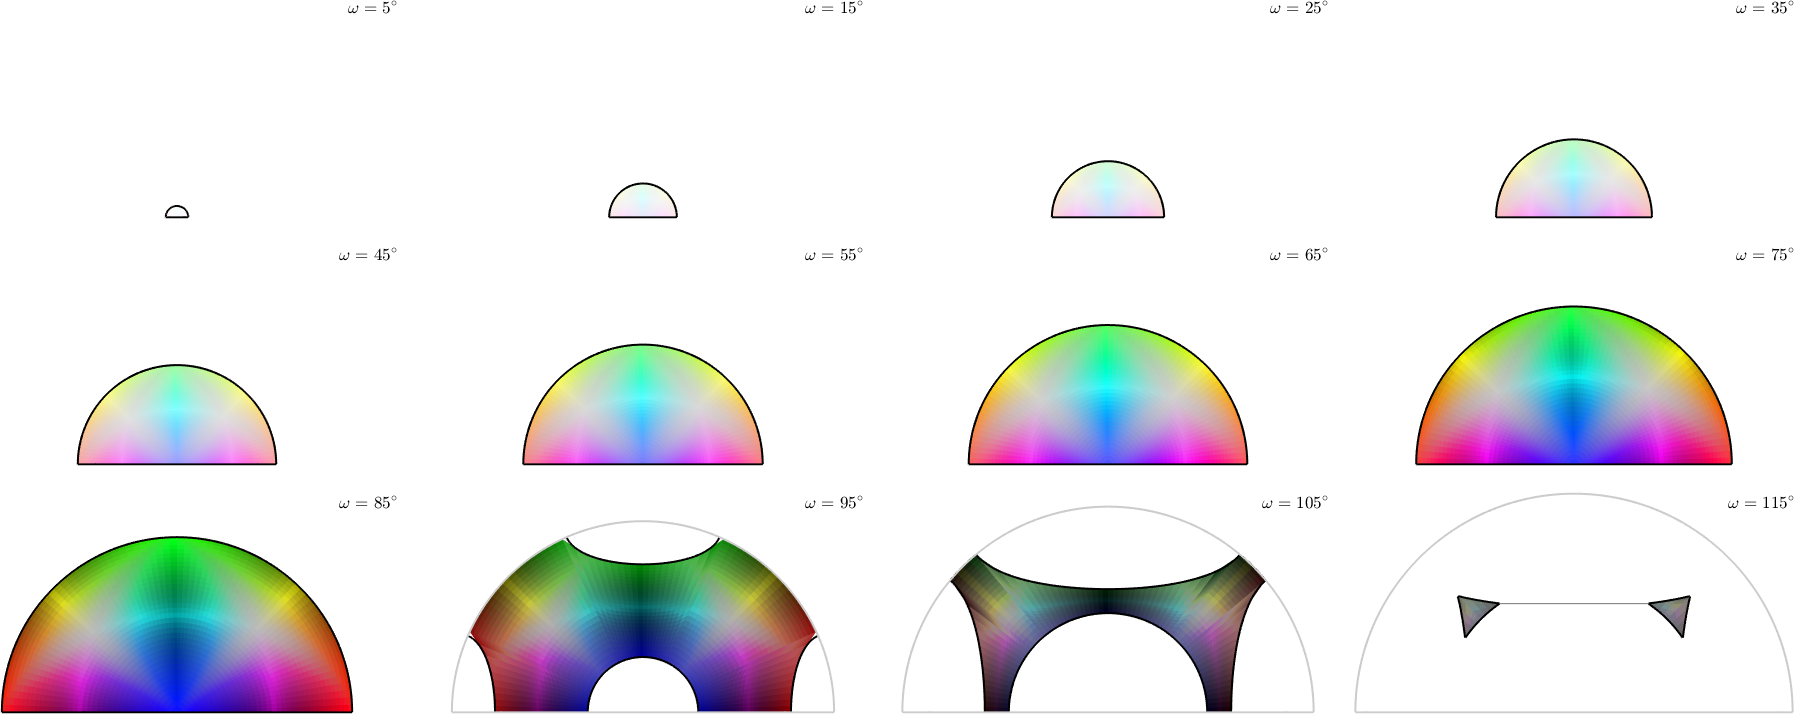
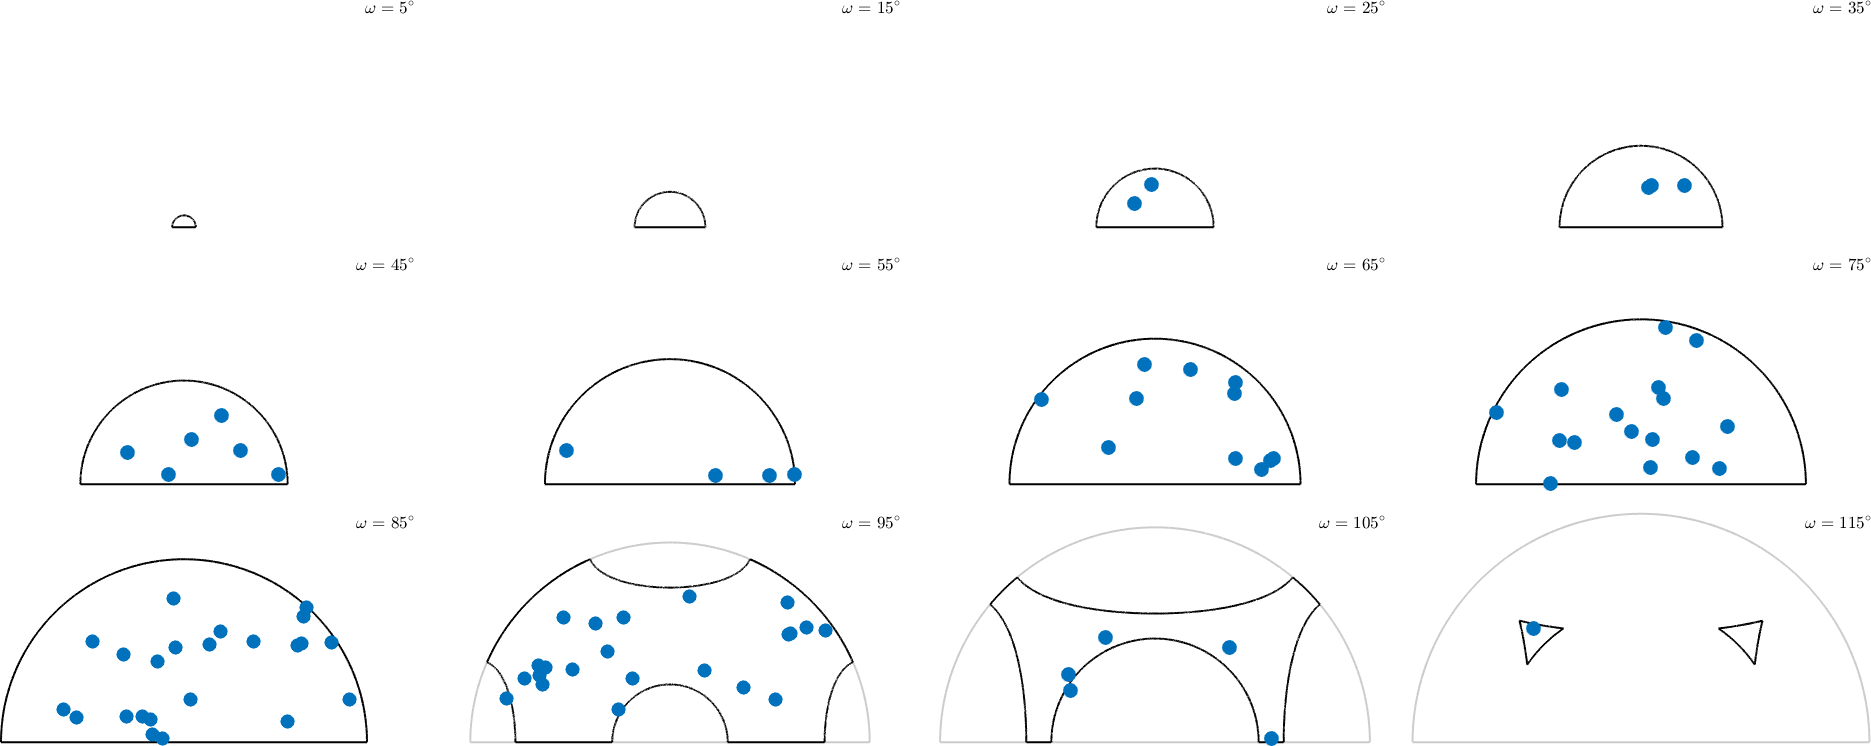
ori = orientation.rand(100,cs,cs)
plot(oS,ori)
ori = misorientation (222 → 222)
size: 100 x 1