plot ODF sections
Syntax
plotSection(F,varargin)Options
| sections | number of sections |
| points | number of orientations to be plotted |
| all | plot all orientations |
| resolution | resolution of each plot |
Flags
| phi2 | phi2 sections (default) |
| phi1 | phi1 sections |
| gamma | gamma sections |
| sigma | sigma = phi1 - phi2 sections |
| axisAngle | rotational angle sections |
| smooth | smooth plot |
| countourf | filled contour plot |
| contour | contour lines |
| contour3, surf3, slice3 | 3d volume plot |
Example
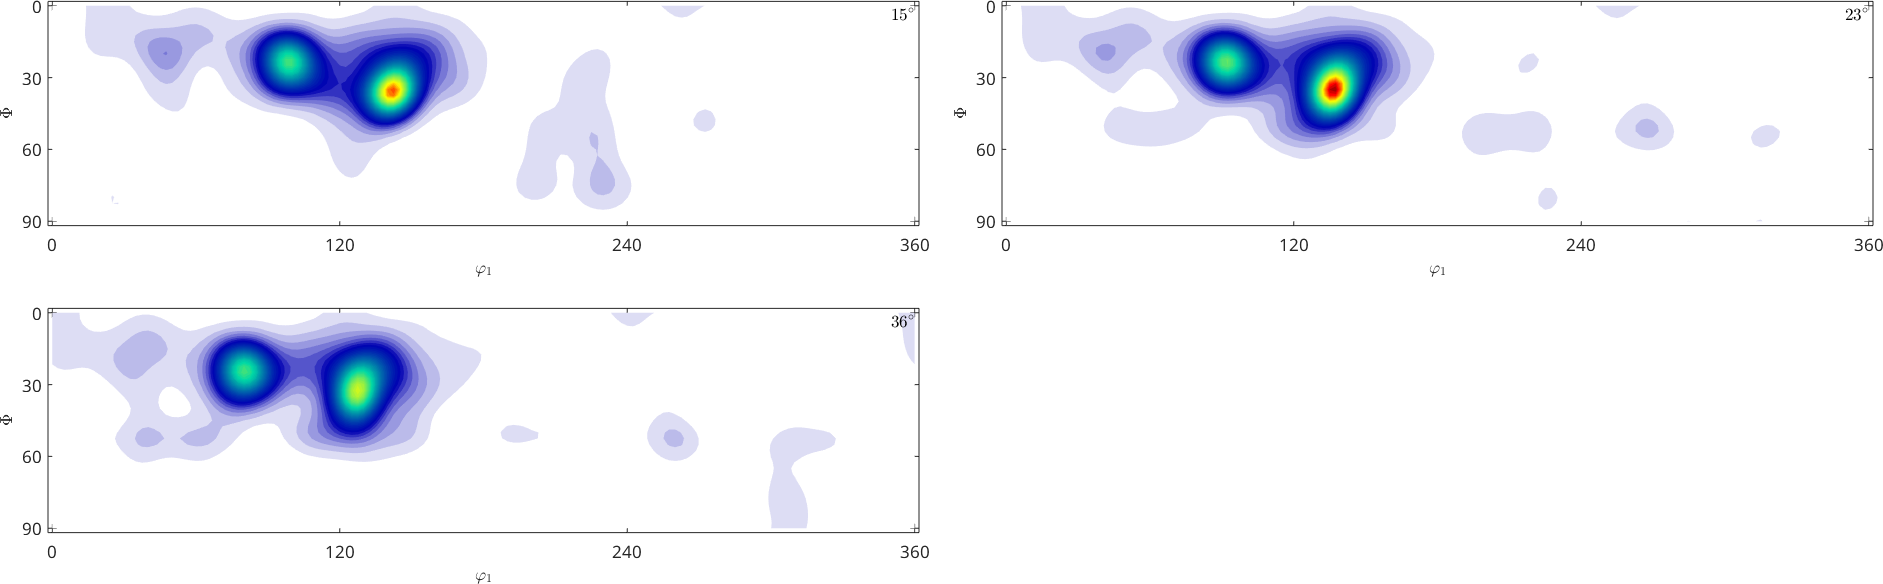
section plots at specific angles
plotSection(SO3Fun.dubna,'phi2',[15,23,36]*degree)