draw rotations connected by lines
Syntax
line(rot,'linecolor','r','linewith',2)Input
| rot | list of rotation |
Example
cs1 = crystalSymmetry('321')
cs2 = crystalSymmetry('432')
oR = fundamentalRegion(cs1,cs2)
plot(oR)
cs1 = crystalSymmetry
symmetry : 321
elements : 6
a, b, c : 1, 1, 1
reference frame: X||a*, Y||b, Z||c*
cs2 = crystalSymmetry
symmetry: 432
elements: 24
a, b, c : 1, 1, 1
oR = orientationRegion
crystal symmetry: 321, X||a*, Y||b, Z||c*
crystal symmetry: 432
max angle: 56.6003°
face normales: 14
vertices: 20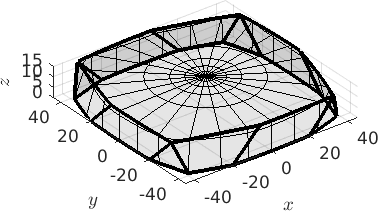
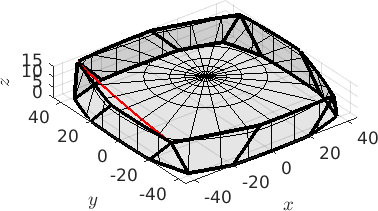
connect to vertices of the fundamental region
f = fibre(oR.V(1),oR.V(2))f = fibre (321 → 432)
h || r: (-3 11 -8 4) || ((0 11 -4))
o1 → o2: (11-20) || (110) [0001] || [-111] → (0001) || (111) [01-10] || [01-1]determine some orientations along the fibre
o = f.orientationo = misorientation (321 → 432)
size: 2000 x 1plot the line
hold on
line(o,'color','r','linewidth',2)
hold off