select EBSD data by spatial coordinates
Syntax
map = findByLocation( ebsd, xy, y )Input
| ebsd | EBSD |
| xy | list of [x(:) y(:)] coordinates, respectively [x(:) y(:) z(:)] |
Output
| ebsd | EBSD subset |
Example
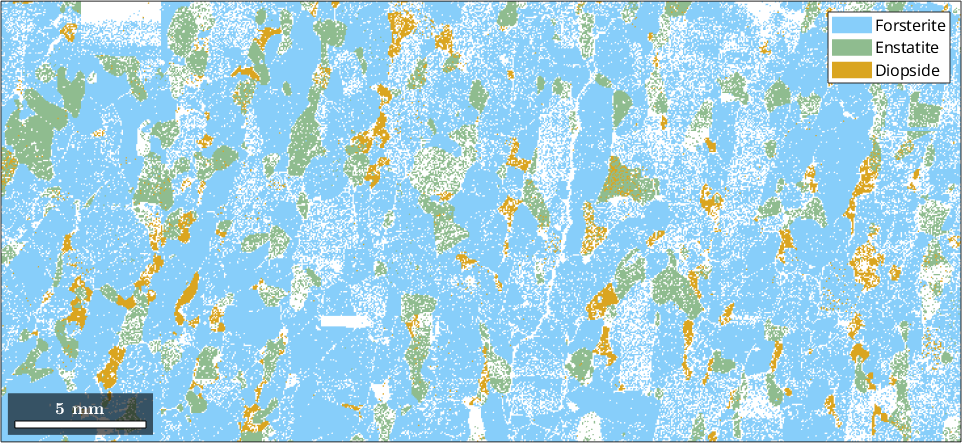
mtexdata forsterite silentplot(ebsd)
p = [10000 5000] %ginput(1)
g = findByLocation(ebsd,p)p =
10000 5000
g =
73401