sort orientations into clusters
Syntax
[c,center] = calcCluster(ori,'halfwidth',2.5*degree)
[c,center] = calcCluster(ori,'numCluster',n,'method','hierarchical')
[c,center] = calcCluster(ori,'maxAngle',omega,'method','hierarchical')
Input
| ori | orientation |
| n | number of clusters |
| omega | maximum angle |
Output
| c | list of clusters |
| center | center of the clusters |
Example
generate orientation clustered around 5 centers
cs = crystalSymmetry('432');
center = orientation.rand(5,cs);
odf = unimodalODF(center,'halfwidth',5*degree)
ori = odf.discreteSample(1500);
odf = SO3FunRBF (432 → y↑→x)
multimodal components
kernel: de la Vallee Poussin, halfwidth 5°
center: 5 orientations
Bunge Euler angles in degree
phi1 Phi phi2 weight
156.958 109.836 223.608 0.2
9.33344 126.207 190.491 0.2
197.878 76.1995 48.4488 0.2
156.716 113.621 184.888 0.2
151.332 117.797 66.3984 0.2find the clusters and its centers
[cId,centerRec] = calcCluster(ori,'silent');visualize result
for i = 1:length(centerRec)
plot(ori(cId==i),'axisAngle')
hold on
plot(centerRec(i),'MarkerFaceColor','k','MarkerSize',15)
end
hold off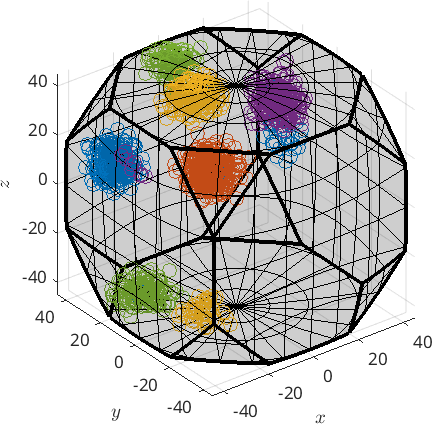
%check the accuracy of the recomputed centers
min(angle_outer(center,centerRec)./degree)
ans =
0.6137 2.0637 1.0360 2.1478 1.4003