The Lankford parameter, also referred to as the Lankford coefficient, the R-value or plastic strain ratio, is an important material property in the field of mechanical metallurgy, particularly in the study of sheet metal forming processes. It is often used to optimize manufacturing processes, especially in industries like automotive and aerospace, where sheet metal components are extensively utilized.
The Lankford parameter quantifies the anisotropy of a material's plastic deformation behavior. It is the ratio of the true width strain to the true thickness strain at a particular value of length strain. This scalar quantity is used extensively as an indicator of formability.
R-values can vary widely depending on the material and its processing history:
- Materials with high R-values, typically ranging from ~1 to 2.5 or higher, exhibit a strong degree of anisotropy in their deformation behavior. This means they deform significantly more in one direction compared to perpendicular directions.
- Alternatively, materials with low R-values, typically close to zero or even slightly negative, exhibit more isotropic deformation characteristics such that they tend to deform relatively uniformly in all directions.
The R-value is highly relevant to forming operations:
- Materials with high R-values are often preferred for forming processes. This is because they exhibit a strong tendency to elongate in one direction while constraining deformation in the perpendicular directions. This can lead to improved formability and allows for more complex shapes to be produced without causing defects like cracks or wrinkles.
- On the other hand, materials with low R-values may be less suitable for certain forming operations. Since they tend to be less anisotropic, it results in more uniform deformation but that in turn may limit the complexity of shapes that can be produced without defects.
Understanding the R-value of a material is crucial in sheet metal forming processes as it helps manufacturers select the right material for a specific application.
For example, in the automotive industry, materials with high R-values are often chosen for parts like car body panels, where complex shapes are common.
On the other hand, materials with lower R-values may be more suitable for applications where uniformity of deformation is critical. An example is the production of deep drawn parts, such as cylindrical containers or cans. In deep drawing, a flat sheet of metal is formed into a three-dimensional shape by being drawn into a die cavity. This process requires uniform deformation of the material to avoid wrinkles, or uneven thickness distribution (thinning) in areas around the drawn part. Consequently, materials with lower r-values, which exhibit more isotropic deformation behavior, are better suited for deep drawing applications since they are less likely to show preferential deformation in one direction. Instead, they are more likely to deform uniformly in all directions, ensuring a consistent shape is produced.
To experimentally calculate the Lankford parameter, uniaxial tensile tests at different angles to the rolling direction are required. The R-value is then calculated as the ratio of the transverse strain (i.e. - perpendicular to the loading direction) to the axial strain (i.e. - along the loading direction).
In the context of crystallography and electron backscattering diffraction (EBSD) analysis, understanding the Lankford parameter is crucial for predicting how a material will deform under different loading conditions.
In terms of MATLAB and the MTEX toolbox, the the Lankford parameter or R-value is modelled or estimated on the basis of crystallographic orientations and the Taylor theory as demonstrated below.
Example 1: The Lankford parameter (or R-value) of a single orientation
In this example, a single (1 1 0)[1 -1 2] Brass orientation is used.
% define an fcc crystal system
CS = crystalSymmetry('m-3m', [1 1 1], 'mineral', 'fcc');

% define the fcc slip system
sS = slipSystem.fcc(CS)

% use MTEX's pre-defined (1 1 0)[1 -1 2] Brass orientation
ori = orientation.brass(CS);

% compute the Lankford parameter
rho = linspace(0,1,11);
[R, M, minM] = calcLankford(ori,sS,'verbose','rho',rho);
sS = slipSystem (fcc)
u v w | h k l CRSS
0 1 -1 1 1 1 1
---
M at 0° to tA = 1.841
M at 45° to tA = 1.7817
M at 90° to tA = 1.7509
---
R at 0° to tA = 1
R at 45° to tA = 1
R at 90° to tA = 2.3333
---
Rbar = 0.66667
---The summary results show that for the Brass orientation, it is not always possible to predict the R-value as Inf values are predicted at 45° and 90° to the nominal rolling direction (or in this case, x).
The computed Taylor factor allows us to recreates Fig. 3.10 on page 74 of: [William F. Hosford, The mechanics of crystals and textured polycrystals] (https://onlinelibrary.wiley.com/doi/epdf/10.1002/crat.2170290414) It shows the dependence of \(M\) on \(\rho = -d_{\epsilon}_Y / d_{\epsilon}_X = \frac{R}{1+R}\) for rolling and transverse direction tension tests for an ideal Brass orientation. In the rolling direction test, x = [1 -1 2], and in the transverse test x = [-1 1 1].
plot(rho, M(:,[1,10,19]).','-s','lineWidth',2);
xlabel('{\rho} = -d{\epsilon}_Y / d{\epsilon}_X');
ylabel('Relative strength, M = {\sigma}_x / {\tau}');
legend('\theta=0^\circ','\theta=45^\circ','\theta=90^\circ','Location','northeast');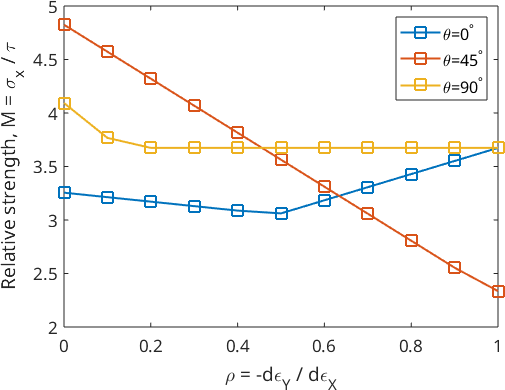
Example 2: The Lankford parameters from an ODF
In the previous chapter we have assumed a perfectly Brass oriented texture. Lets next assume a slight deviation around the preferred orientation of about 10 degree modeled by the ODF
odf = unimodalODF(ori,'halfwidth',10*degree)odf = SO3FunRBF (fcc → xyz)
unimodal component
kernel: de la Vallee Poussin, halfwidth 10°
center: 1 orientations
Bunge Euler angles in degree
phi1 Phi phi2 weight
35 45 0 1Performing, the Lankford factor analysis on the ODF results in
[R, M, minM] = calcLankford(odf,sS,'silent','rho',rho);

plot(rho, M(:,[1,10,19]).','-s','lineWidth',2);
xlabel('{\rho} = -d{\epsilon}_Y / d{\epsilon}_X');
ylabel('Relative strength, M = {\sigma}_x / {\tau}');
legend('\theta=0^\circ','\theta=45^\circ','\theta=90^\circ','Location','northeast');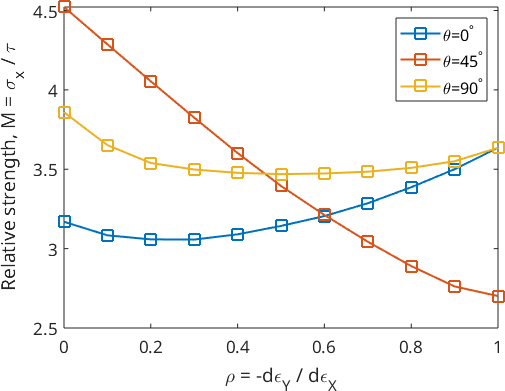
Example 3: The Lankford parameter of an EBSD map
In this demonstration an hcp titanium dataset is used
% load an mtex ebsd map
mtexdata titanium

% define the crystal system
CS = ebsd.CS;

% reconstruct the grains
[grains,ebsd.grainId] = calcGrains(ebsd,'angle',5*degree);

% remove small grains
ebsd(grains(grains.grainSize <= 5)) = [];

% recalculate the grains
[grains,ebsd.grainId] = calcGrains(ebsd,'angle',5*degree);

% plot the orientations
plot(ebsd,ebsd.orientations);
hold all
plot(grains.boundary,'lineWidth',2);
hold off
ebsd = EBSD
Phase Orientations Mineral Color Symmetry Crystal reference frame
0 8100 (100%) Titanium (Alpha) LightSkyBlue 622 X||a, Y||b*, Z||c*
Properties: ci, grainid, iq, sem_signal
Scan unit : um
X x Y x Z : [0 996] x [0 998] x [0 0]
Normal vector: (0,0,1)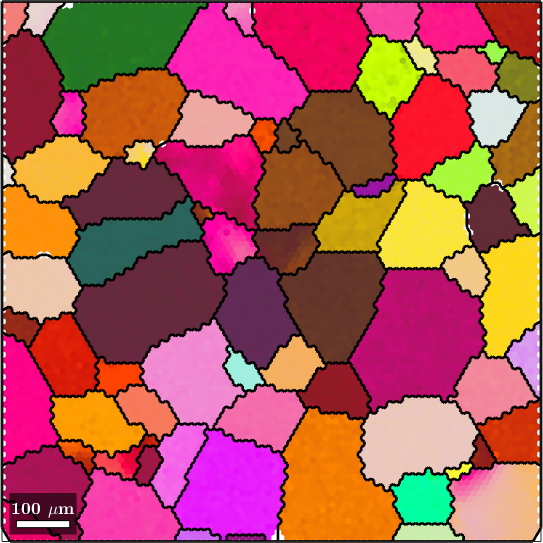
define the hcp slip systems
Since Taylor theory is used to compute the Lankford parameter, multiple slip systems and their corresponding critical resolved shear stresses slip systems can be employed.
sS = [slipSystem.basal(CS,1),...
  slipSystem.prismatic2A(CS,66),...
  slipSystem.pyramidalCA(CS,80),...
  slipSystem.twinC1(CS,100)]
sS = slipSystem (Titanium (Alpha))
size: 1 x 4
U V T W | H K I L CRSS
1 1 -2 0 0 0 0 1 1
0 1 -1 0 2 -1 -1 0 66
2 -1 -1 3 -1 1 0 1 80
-1 1 0 -2 -1 1 0 1 100compute the Lankford parameter
The Lankford parameter is computed using the command calcLankford. It solely depends on the texture provided by the mean orientations of the grains, weighted by the area of the grains and the angle \(\theta\) between the tensile direction and the rolling direction. In the case of the latter, the default reference direction is \(x\).
theta = linspace(0,90*degree,19);
[R, M, minM] = calcLankford(grains.meanOrientation,sS,theta,'weights',grains.grainSize,'verbose');
---
M at 0° to tA = 1.7682
M at 45° to tA = 1.7585
M at 90° to tA = 1.9676
---
R at 0° to tA = 0.25
R at 45° to tA = 1
R at 90° to tA = 1
---
Rbar = -0.375
---The following plot shows the Lankford parameter, as a function of the angle \(\theta\) between the tensile direction and the notional rolling direction (in this case - x).
clf
plot(theta ./ degree,R,'o-r','lineWidth',1.5);
xlabel('Angle to tensile direction, {\theta} (in degrees)');
ylabel('R @ M_m_i_n, R = {\rho} / (1 - {\rho}) = -d{\epsilon}_Y / d{\epsilon}_Z');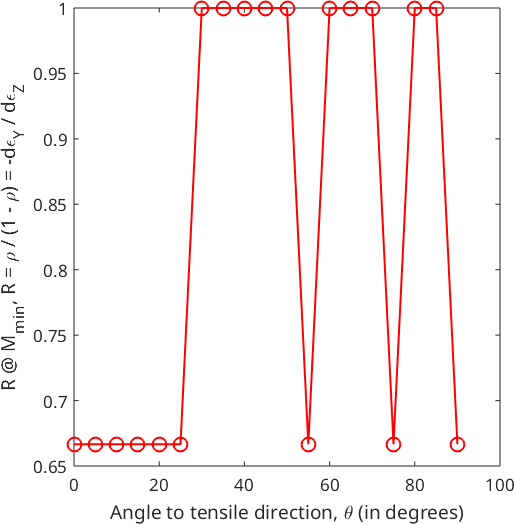
Similarly, the next plot shows the Taylor factor as a function of the angle \(\theta\) between the tensile direction and the notional rolling direction (in this case - x).
plot(theta ./ degree,minM,'o-b','lineWidth',1.5);
xlabel('Angle to tensile direction, {\theta} (in degrees)');
ylabel('Min. relative strength, min(M) = min({\sigma}_x / {\tau}min(M))');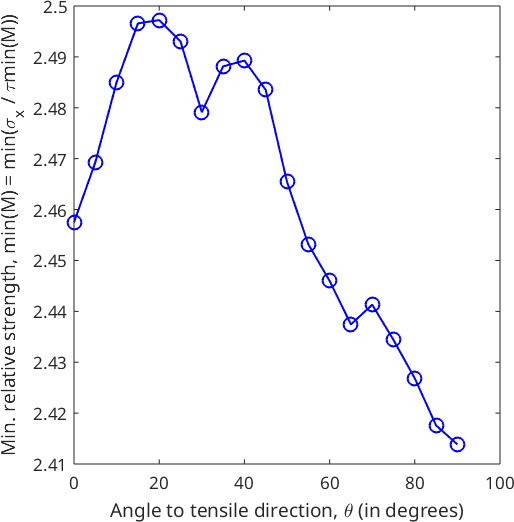
The R-value can also be used to compute two additional values that are of importance to sheet metal operations:
- The normal anisotropy ratio (Rbar, or Ravg, or rm) defines the ability of the metal to deform in the thickness direction relative to deformation in the plane of the sheet. For Rbar values >= 1, the sheet metal resists thinning, improves cup drawing, hole expansion, and other forming modes where metal thinning is detrimental. For Rbar < 1, thinning becomes the preferential metal flow direction, increasing the risk of failure in drawing operations.
Rbar = 0.5 * (R(1) + R(19) + 2*R(10))Rbar =
1.6250- A related parameter is the planar anisotropy parameter (deltaR) which is an indicator of the ability of a material to demonstrate non-earing behavior. A deltaR value = 0 is ideal for can-making or deep drawing of cylinders, as this indicates equal metal flow in all directions; thus eliminating the need to trim ears during subsequent processing.
deltaR = 0.5 * (R(1) + R(19) - 2*R(10))deltaR =
-0.3750