Birefrigence
Birefringence is the optical property of a material having a refractive index that depends on the polarization and propagation direction of light. It is one of the oldest methods to determine orientations of crystals in thin sections of rocks.
Import Olivine Data
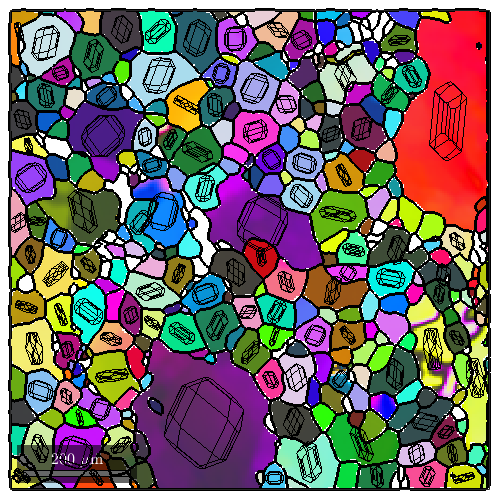
In order to illustarte the effect of birefringence lets consider a olivine data set.
mtexdata olivine

% reconstruct grains
[grains,ebsd.grainId] = calcGrains(ebsd('indexed'));
ebsd(grains(grains.grainSize < 5)) = [];
[grains,ebsd.grainId] = calcGrains(ebsd('indexed'));

% some data denoising
grains = smooth(grains,5);

F = splineFilter;
ebsd = smooth(ebsd,F,'fill',grains);
 loading data ...
 saving data to /home/hielscher/mtex/master/data/olivine.mat
 denoising EBSD data: 100%
% plot the olivine phase
plot(ebsd('olivine'),ebsd('olivine').orientations);
hold on
plot(grains.boundary,'lineWidth',2)
hold off

gg = grains(grains.grainSize > 100);
gg = gg('o')
cS = crystalShape.olivine;
hold on
plot(gg,0.8*cS,'FaceColor','none')
hold off
gg = grain2d

 Phase  Grains  Pixels  Mineral  Symmetry  Crystal reference frame
     1     109   30800  olivine       222

 boundary segments: 6806
 triple points: 561

 Properties: GOS, meanRotation
The refractive index tensor
The refractive index of a material describes the dependence of the speed of light with respect to the propagation direction and the polarization direction. In a linear world this relation ship is modeled by a symmetric rank 2 tensor - the so called refractive index tensor, which is usually given by it principle values: n_alpha, n_beta and n_gamma. In orthorhombic minerals such as olivine the principal values are parallel to the crystallographic axes. Care has to be applied when associating the principle values with the correct axes.
For Forsterite the priniple refractive values are
n_alpha = 1.635; n_beta = 1.651; n_gamma = 1.670;
with the largest refractive index n_gamma beeing alligned with the a-axis, the intermediate index n_beta with the c-axis and the smallest refractive index n_alpha with the b-axis. Hence, the refractive index tensor for Forsterite takes the form
cs = ebsd('olivine').CS;
rI_Fo = refractiveIndexTensor(diag([ n_gamma  n_alpha  n_beta]),cs)
rI_Fo = refractiveIndexTensor
  rank   : 2 (3 x 3)
  mineral: olivine (222)

  1.67     0     0
     0 1.635     0
     0     0 1.651
For Fayalite the priniple refractive values
n_alpha = 1.82; n_beta = 1.869; n_gamma = 1.879;
are aligned to the crystallograhic axes in an analogous way. Which leads to the refractive index tensor
rI_Fa = refractiveIndexTensor(diag([ n_gamma n_alpha n_beta]),cs)
rI_Fa = refractiveIndexTensor
  rank   : 2 (3 x 3)
  mineral: olivine (222)

 1.879     0     0
     0  1.82     0
     0     0 1.869
The refractive index of composite materials like Olivine can now be modelled as the weighted sum of the of the refractive index tensors of Forsterite and Fayalite. Lets assume that the relative Forsterite content (atomic percentage) is sgiven my
XFo = 0.86; % 86 percent ForsteriteThen is refractive index tensor becomes
rI = XFo*rI_Fo + (1-XFo) * rI_Fa
rI = refractiveIndexTensor
  rank   : 2 (3 x 3)
  mineral: olivine (222)

 1.6993      0      0
      0 1.6609      0
      0      0 1.6815
Birefringence
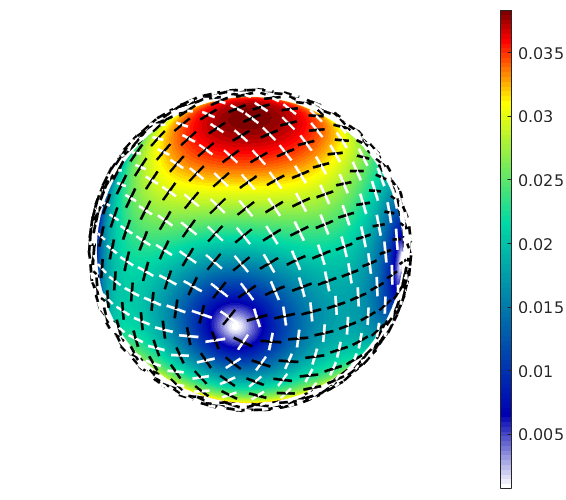
The birefringence describes the difference n in diffraction index between the fastest polarization direction pMax and the slowest polarization direction pMin for a given propagation direction vprop.
% lets define a propagation direction
vprop = Miller(1,1,1,cs);

% and compute the birefringence
[dn,pMin,pMax] = rI.birefringence(vprop)
dn =
    0.0245

pMin = vector3d
 size: 1 x 1
        x         y         z
  0.19057 -0.932509  0.306774

pMax = vector3d
 size: 1 x 1
          x         y         z
  -0.650059  0.114293  0.751239
If the polarization direction is ommited the results are spherical functions which can be easily visualized.
% compute the birefringence as a spherical function
[dn,pMin,pMax] = rI.birefringence

% plot it
plot3d(dn,'complete')
mtexColorbar

% and on top of it the polarization directions
hold on
quiver3(pMin,'color','white')
quiver3(pMax)
hold off
dn = S2FunHarmonic
 mineral: olivine (222)
 bandwidth: 48

pMin = S2AxisFieldHarmonic
 bandwidth: 48

pMax = S2AxisFieldHarmonic
 bandwidth: 48
The Optical Axis
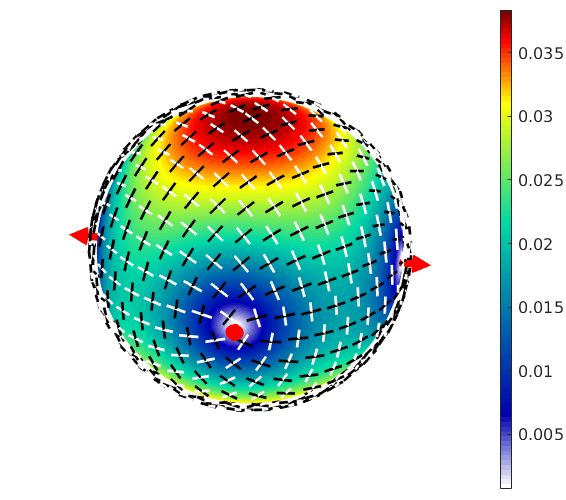
The optial axes are all directions where the birefringence is zero
% compute the optical axes
vOptical = rI.opticalAxis

% and check the birefringence is zero
rI.birefringence(rI.opticalAxis)

% annotate them to the birefringence plot
hold on
arrow3d(vOptical,'antipodal','facecolor','red')
hold off
vOptical = vector3d
 size: 1 x 2
 antipodal: true
          x         y         z
  -0.680045  0.733171         0
   0.680045  0.733171         0
ans =
   1.0e-15 *
    0.4441
    0.4441
Spectral Transmission
If white with a certain polarization is transmited though a crystal with isotropic refrative index the light changes wavelength and hence appears collored. The resulting color depending on the propagation direction, the polarization direction and the thickness can be computed by
vprop = Miller(1,1,1,cs);
thickness = 30000;
p =  Miller(-1,1,0,cs);
rgb = rI.spectralTransmission(vprop,thickness,'polarizationDirection',p)
rgb =
0.3635 0.7380 0.6967
Effectively, the rgb value depend only on the angle tau between the polariztzion direction and the slowest polarization direction pMin. Instead of the polarization direction this angle may be specified directly
rgb = rI.spectralTransmission(vprop,thickness,'tau',30*degree)rgb =
0.3128 0.6350 0.5994
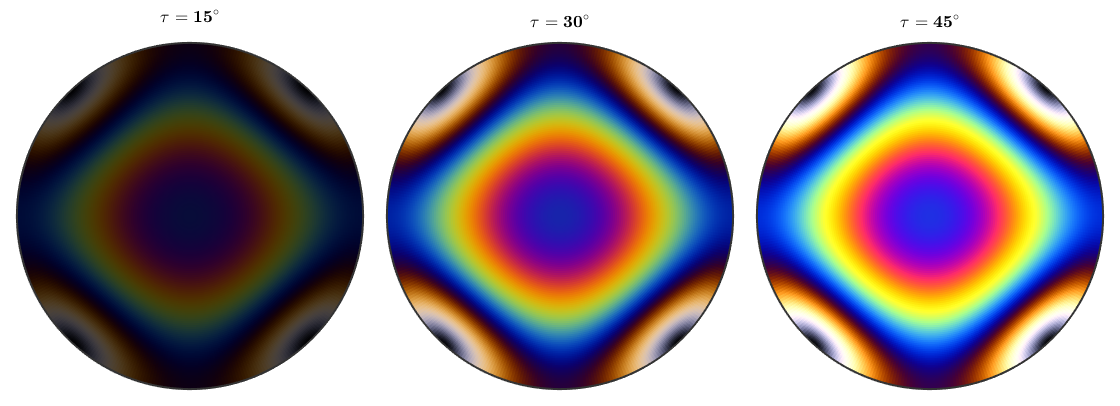
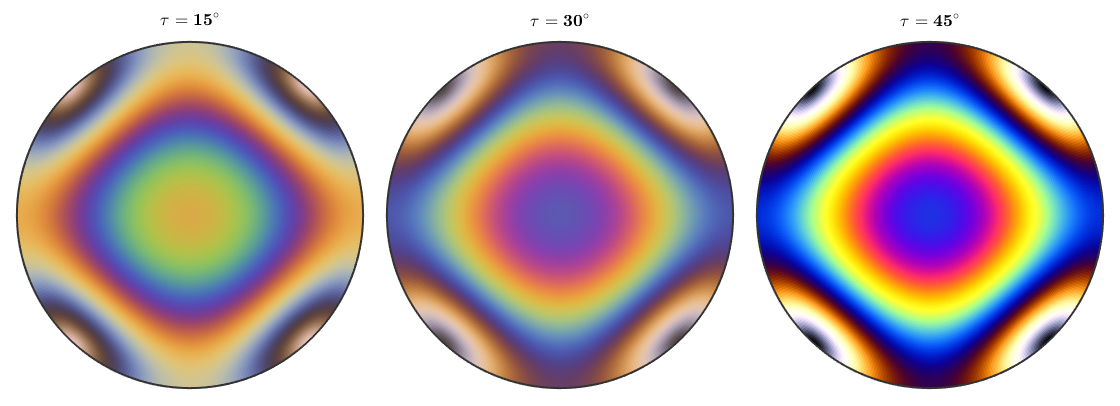
If the angle tau is fixed and the propagation direction is ommited as input MTEX returns the rgb values as a spherical function. Lets plot these functions for different values of tau.
newMtexFigure('layout',[1,3]);

mtexTitle('$\tau = 15^{\circ}$')
plot(rI.spectralTransmission(thickness,'tau',15*degree),'rgb')

nextAxis
mtexTitle('$\tau = 30^{\circ}$')
plot(rI.spectralTransmission(thickness,'tau',30*degree),'rgb')

nextAxis
mtexTitle('$\tau = 45^{\circ}$')
plot(rI.spectralTransmission(thickness,'tau',45*degree),'rgb')

drawNow(gcm,'figSize','normal')
Usually, the polarization direction is chosen at angle phi = 90 degree of the analyzer. The following plots demonstrate how to change this angle
newMtexFigure('layout',[1,3]);

mtexTitle('$\tau = 15^{\circ}$')
plot(rI.spectralTransmission(thickness,'tau',45*degree,'phi',30*degree),'rgb')

nextAxis
mtexTitle('$\tau = 30^{\circ}$')
plot(rI.spectralTransmission(thickness,'tau',45*degree,'phi',60*degree),'rgb')

nextAxis
mtexTitle('$\tau = 45^{\circ}$')
plot(rI.spectralTransmission(thickness,'tau',45*degree,'phi',90*degree),'rgb')

drawNow(gcm,'figSize','normal')
Spectral Transmission at Thin Sections
All the above computations have been performed in crystal coordinates. However, in practical applications the direction of the polarizer as well as the propagation direction are given in terms of specimen coordinates.
% the propagation direction
vprop = vector3d.Z;

% the direction of the polarizer
polarizer = vector3d.X;

% the thickness of the thin section
thickness = 22800;
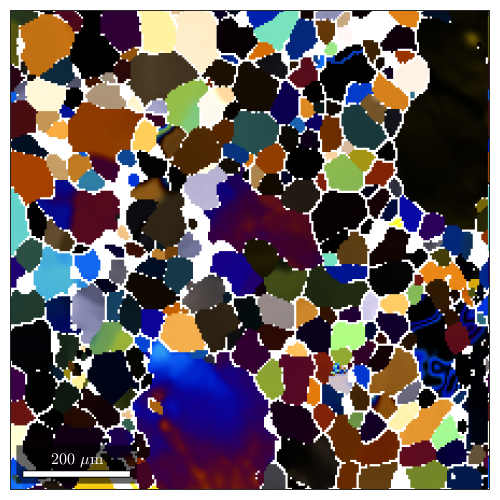
As usal we have two options: Either we transform the refractive index tensor into specimen coordinates or we transform the polarization direction and the propagation directions into crystal coordinates. Lets start with the first option:
% extract the olivine orientations
ori = ebsd('olivine').orientations;

% transform the tensor into a list of tensors with respect to specimen
% coordinates
rISpecimen = ori * rI;

% compute RGB values
rgb = rISpecimen.spectralTransmission(vprop,thickness,'polarizationDirection',polarizer);

% colorize the EBSD maps according to spectral transmission
plot(ebsd('olivine'),rgb)
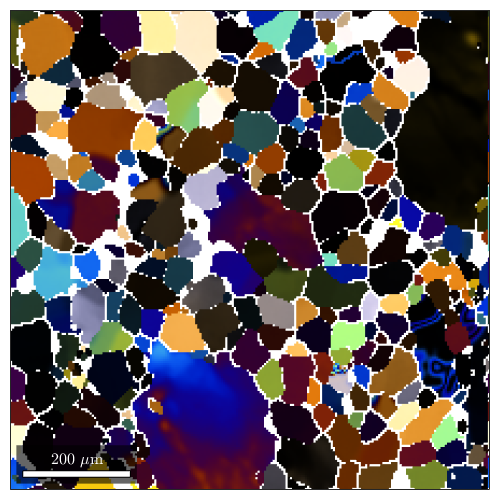
and compare it with option two:
% transfom the propation direction and the polarizer direction into a list
% of directions with respect to crystal coordinates
vprop_crystal = ori \ vprop;
polarizer_crystal = ori \ polarizer;

% compute RGB values
rgb = rI.spectralTransmission(vprop_crystal,thickness,'polarizationDirection',polarizer_crystal);

% colorize the EBSD maps according to spectral transmission
plot(ebsd('olivine'),rgb)
Spectral Transmission as a color key
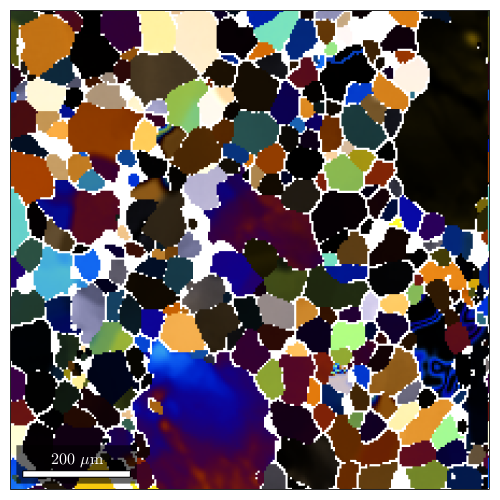
The above computations can be automized by defining a spectral transmission color key.
% define the colorKey
colorKey  = spectralTransmissionColorKey(rI,thickness);

% the following are the defaults and can be ommited
colorKey.propagationDirection = vector3d.Z;
colorKey.polarizer = vector3d.X;
colorKey.phi = 90 * degree;

% compute the spectral transmission color of the olivine orientations
rgb = colorKey.orientation2color(ori);

plot(ebsd('olivine'), rgb)
As usual we me visualize the color key as a colorization of the orientation space, e.g., by plotting it in sigma sections:
plot(colorKey,'sigma')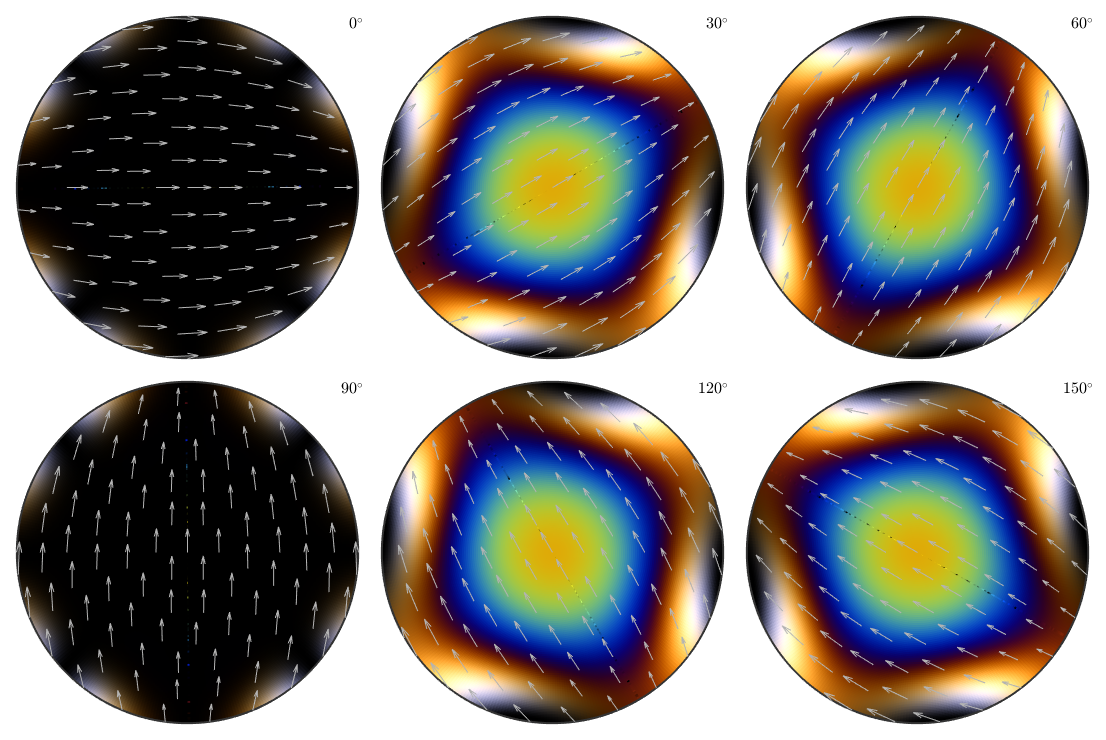
Circular Polarizer
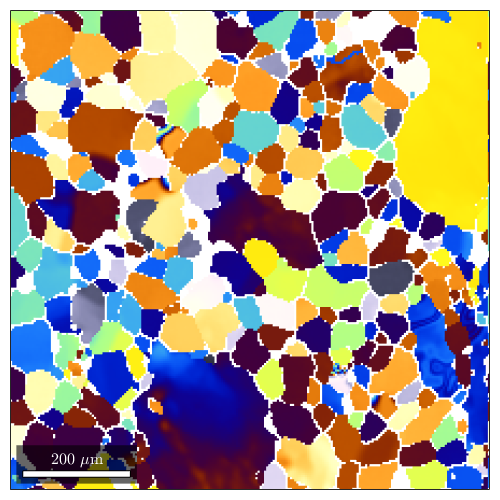
In order to simulate we a circular polarizer we simply set the polarizer direction to empty, i.e.
colorKey.polarizer = [];

% compute the spectral transmission color of the olivine orientations
rgb = colorKey.orientation2color(ori);

plot(ebsd('olivine'), rgb)
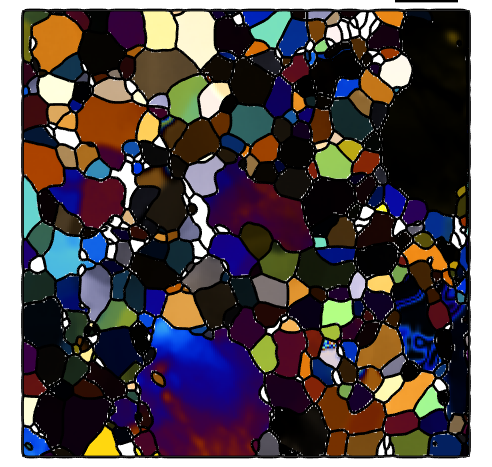
Illustrating the effect of rotating polarizer and analyser simultanously
colorKey.polarizer = vector3d.X;
figure
plotHandle = plot(ebsd('olivine'),colorKey.orientation2color(ori),'micronbar','off');
hold on
plot(grains.boundary,'lineWidth',2)
hold off
textHandle = text(750,50,[num2str(0,'%10.1f') '\circ'],'fontSize',15,...
  'color','w','backGroundColor', 'k');

% define the step size in degree
stepSize = 2.5;

for omega = 0:stepSize:90-stepSize

  % update polarsation direction
  colorKey.polarizer = rotate(vector3d.X, omega * degree);

  % update rgb values
  plotHandle.FaceVertexCData = colorKey.orientation2color(ori);

  % update text
  textHandle.String = [num2str(omega,'%10.1f') '\circ'];

  drawnow

end
| DocHelp 0.1 beta |